Unanswered [1] | Urgent [0]
  

Home / Writing Feedback   % width   Posts: 5


The proportion of the population aged 65 and over between 1940 and 2040. Writing Task 1


Karlito 2 / 2  
Jan 22, 2014   #1
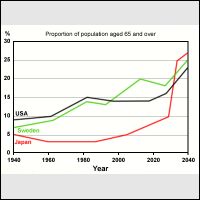
The graph shows the percentage of total number of inhabitants in different areas between 1940 and 2040 with aged 65 and over.

First of all, consider the period from 1940 to 2000. In this period the USA peaked with the highest percentage of population aged 65 and over only with 15%. But at the same time the percentage in Sweden has a small difference by 2 %.

After that, in 2010 the total number of such people in Sweden increased to 20%. Although, an interval in the USA of this time did not change.

Moreover, in the whole period Japan rose slightly from 5% to 10%. But in the end in 2030 the proportion of the age climbed sharply to 25%.

In conclusion, we can see that Japan the most popular centenarians nowadays and they have the greatest percentage of people who are over 65 years old with 27% .Besides, the proportion of ageing population in USA and Sweden will be predicted to rise such as Japan.

(167 words)

  • 221736_1.jpg


MisterWandering 18 / 314  
Jan 22, 2014   #2
The graph shows the percentage of total number of inhabitants in different areas between 1940 and 2040 with aged 65 and over.

The line graph provides information about the changes in the percentage of the ageing population from 1940 to 2040 in Japan, Sweden and the USA.

First of all, consider the period from 1940 to 2000

This sentence has grammatical mistakes and I don't think this is necessary.

In this period the USA peaked with the highest percentage of population aged 65 and over only with 15%. But at the same time the percentage in Sweden has a small difference by 2 %.

The first four decades saw an increase in the proportion of American people aged 65 and over, reaching 15% in 1980, which was slightly higher than that of Swedish people.

After that, in 2010 the total number of such people in Sweden increased to 20%. Although, an interval in the USA of this time did not change.

The proportion of elderly people in Sweden rose sharply from this point onwards. It is expected to finish the period at 25%, surpassing the corresponding figure for the USA, which remained steady from 1980.

Moreover, in the whole period Japan rose slightly from 5% to 10%. But in the end in 2030 the proportion of the age climbed sharply to 25%.

On the other hand, the proportion of Japanese ageing population underwent a slight drop in the first half of the period, only reaching approximately 3% in 1980. However, it is projected to experience the most significant growth, rising exponentially from 10% in 2030 to around 28% in 2040.

In conclusion, we can see that Japan the most popular centenarians nowadays and they have the greatest percentage of people who are over 65 years old with 27%

In the conclusion, you should give an overview of the most remarkable features of the chart and the figures here are not necessary.
harry109 3 / 6  
Jan 23, 2014   #3
I think that the essay need to be constructed more logically. Also, try to use the transitions such as "meanwhile", "in the mean time", "however", "in contrast" ,... instead of the word "but" at the beginning of the sentences to express a contrast statement.
dumi 1 / 6793  
Jan 23, 2014   #4
Your graph is too small for us to get a clear idea about it. Next time upload a bigger image!
This is the approach I suggest you to follow for this task;
1. Introduce the graph (your first sentence satisfies this requirement)
2. Give an overview (don't give any detail such as data - briefly discuss the main trends)
3. Give the details
Fardhani Putri 23 / 44  
Jan 26, 2014   #5
The good pattern of IELTS in writting task 1 if you have overview/ Main trend
the example for overview :
"In general, it can be seen from the graph that the proportion of population aged 65 and over increased slightly during a hundred year, between 1940 and 2040"


Home / Writing Feedback / The proportion of the population aged 65 and over between 1940 and 2040. Writing Task 1
Do You Need
Academic Writing
or Editing Help?
Fill out one of these forms:

Graduate Writing / Editing:
GraduateWriter form ◳

Best Essay Service:
CustomPapers form ◳

Excellence in Editing:
Rose Editing ◳

AI-Paper Rewriting:
Robot Rewrite ◳

Academic AI Writer:
Custom AI Writer ◳