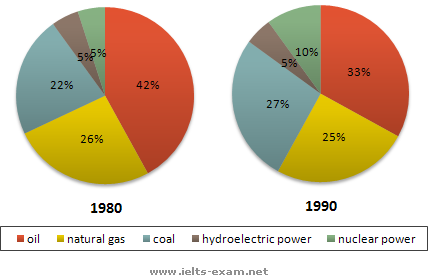
The charts compare changes in the share of sources of energy in United States in two different decades . Generally , while tow experienced rises , there were declines in the two .
According to the diagrams , oil accounted for the most significant proportion in 1980 ( 42 % ) while it had a considerable decrease ( 9 % ) over 10 years . The contribution of natural gas approximately remained constant ( only 1 % ) as well as hydroelectric power at an insignificant { humble } level . Whereas nuclear power had a substantial growth which doubled from 5 % to 10 % .There was a 5 % rise in coal contribution , which climbed 22 % to 27 % .
Overall , oil contributed the largest proportion of source of energy throughout the survey , however hydroelectric power had the smallest share .
-----
My friends this essay is too short but i want to know about grammatical mistakes . Thanks all .

image1.png
