ma5noo2
Dec 3, 2016
Writing Feedback / The bar chart below shows the estimated sales of jeans for two companies next year in Turkey. [7]
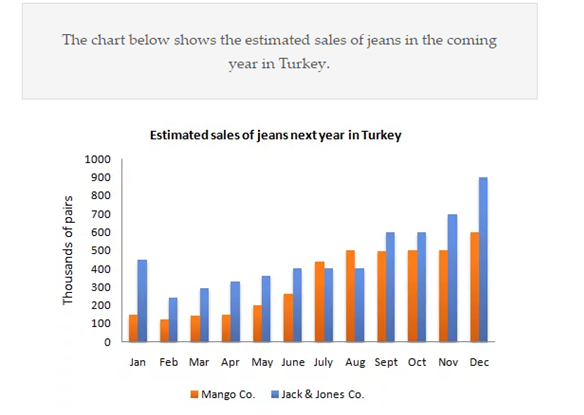
The bar chart below shows the estimated sales of jeans for two companies next year in Turkey.
The chart illustrates the estimated sales of jeans for two companies (Mango co. ,and Jack&Jones co.) next year in Turkey. Unites are measured in thousands of pairs per month.
Overall, the total estimated sales for Jack&Jones co. are higher than those for Mango co., except for July and August where Mango co. bypasses it with a slight difference . The highest predicted sales for both companies are in December , while the lowest are in February.
In the first half of the year , January is predicted to have the highest sales for Jack&Jones co. with almost 500,000 pairs in comparison with those for Mango co. with nearly 200,000 pairs. Sales are estimated to decrease for both companies next month to reach about 250,000 and nearly above 100,000 pairs ,respectively . A gradual increase for both is forecasted to reach 400,000 pairs for Jack&Jones co., and almost 300,00 pairs for Mango co. .
In the second half of the year , Mango co. sales are predicted to rise and bypass those of Jack&Johns co. in both July and August with a difference less or more 100,000 pairs . Again , Jack&Johns co. will take the lead starting from September till the end of the year , with a gradual increase in November to reach 900,000 pairs in December , similarly for Mango co. sales are predicted to be steady till it will rise in December reaching approximately 600,000 pairs.
would you please evaluate this essay (according to IELTS evaluation criteria )
waiting your evaluation and your advises .

chart.png