mygoals
Apr 3, 2017
Writing Feedback / The line graph show the consumption of 3 spreads from 1981 to 2007 - TASK 1 IELTS [3]
Hello guys , i wrote this task and dont know what band i can get ? please check it for me . many thanks <3
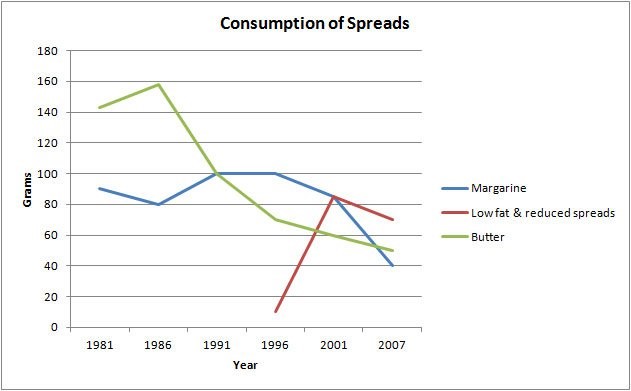
The graph below show the consumption of 3 spreads from 1981 to 2007
The line graph illustrates Margarine , Low fat & reduced spreads and Butter 's consumptions over 16 years from 1981 to 2007 . As it shown in the graph , Margarine was highest around 160 grams at 1991 and 1996 , while Low fat & reduced spreads and Butter were most popular around 100 grams and 85 at 1986 and 2001 . Between 1991 and 1996 , Butter had went down on while Margarine still had a leveling out . By 1999 to the next few years , Low fat & reduced spreads had dramatically increased to peak but Margarine and Butter were falling down . In the last few years on the graph showed that the consumptions of three spreads had all fallen down , specifically Margarine , Low fat & reduced spreads and Butter respectively were around 40 , 70 and 50 at 2007 .
Hello guys , i wrote this task and dont know what band i can get ? please check it for me . many thanks <3
Margarine, Low fat & reduced spreads and Butter consumption
The graph below show the consumption of 3 spreads from 1981 to 2007
The line graph illustrates Margarine , Low fat & reduced spreads and Butter 's consumptions over 16 years from 1981 to 2007 . As it shown in the graph , Margarine was highest around 160 grams at 1991 and 1996 , while Low fat & reduced spreads and Butter were most popular around 100 grams and 85 at 1986 and 2001 . Between 1991 and 1996 , Butter had went down on while Margarine still had a leveling out . By 1999 to the next few years , Low fat & reduced spreads had dramatically increased to peak but Margarine and Butter were falling down . In the last few years on the graph showed that the consumptions of three spreads had all fallen down , specifically Margarine , Low fat & reduced spreads and Butter respectively were around 40 , 70 and 50 at 2007 .

image
