vientrongnghia
Aug 30, 2018
Writing Feedback / TASK1 : The percentage of households in owned and rented accommodation [3]
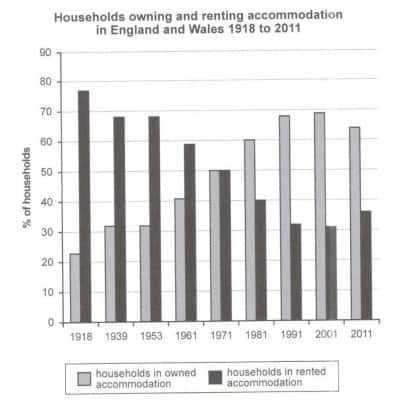
Shown in the bar chart is the proportion of apartments which are possessed and hired in two countries, namely England and Wales, over a 93-year phase between 1918 and 2011
Overall, there was a rising tendency in the families who purchased house; meanwhile, the figure for the remaining followed an opposite drift over the timescale under the investigation.
It can be seen from the bar graph that regarding owned households, this number increased dramatically by roughly 46 from well over 23 to a peak of approximately 69 from 1918 to 2001 in England and Wales, with the period 2001- 2011 witnessing a decline of around 4 to close to 65 in the single year of 2011.
Moving on to the rented ones , it is obvious that there was an enormous decrease of approaching 45 from 77 to a trough of nearly 32 between 1918 to 2001 before England and Wales experienced a slight recovery of 4 to 37 in 2011.
the proportion of apartments possessed and hired in two countries
Shown in the bar chart is the proportion of apartments which are possessed and hired in two countries, namely England and Wales, over a 93-year phase between 1918 and 2011
Overall, there was a rising tendency in the families who purchased house; meanwhile, the figure for the remaining followed an opposite drift over the timescale under the investigation.
It can be seen from the bar graph that regarding owned households, this number increased dramatically by roughly 46 from well over 23 to a peak of approximately 69 from 1918 to 2001 in England and Wales, with the period 2001- 2011 witnessing a decline of around 4 to close to 65 in the single year of 2011.
Moving on to the rented ones , it is obvious that there was an enormous decrease of approaching 45 from 77 to a trough of nearly 32 between 1918 to 2001 before England and Wales experienced a slight recovery of 4 to 37 in 2011.

111.jpg
