Jin_KT
Mar 26, 2019
Writing Feedback / IELTS writing task 1 - line graph of waste produced [3]
I'm really thankful when someone helps me improve this essay. Thank you!
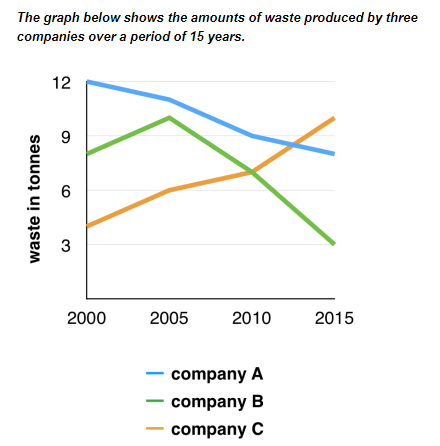
The line graph illustrates how much waste three companies released during a 15 year period from 2000 to 2015. Units are measured in tonnes.
Overall, while the amount of waste produced witnessed a decrease in 2 companies A and B, the opposite was true for the figure for company C.
In 2000, company A held the leading position by releasing 12 tonnes waste while the figures for company B and C were nearly 9 and just above 3 respectively. Over the following 5 years, the amount of waste produced by company A declined slightly by approximately 1. By contrast, both company B and C experienced a moderate rise of nearly 2 in 2005.
The amount of waste released by company A had stood at 11 by 2005 and dropped considerablely by nearly 3 during the following 10 years. In 2005, the figure for company B peaked at nearly 10 before undergoing a dramatical decrease of 7 at the end of period. Meanwhile, a significant climb of 4 was recorded in the amount of waste produced by company C during a 10 year period from 2005 to 2015.
I'm really thankful when someone helps me improve this essay. Thank you!
Waste statistics
The line graph illustrates how much waste three companies released during a 15 year period from 2000 to 2015. Units are measured in tonnes.
Overall, while the amount of waste produced witnessed a decrease in 2 companies A and B, the opposite was true for the figure for company C.
In 2000, company A held the leading position by releasing 12 tonnes waste while the figures for company B and C were nearly 9 and just above 3 respectively. Over the following 5 years, the amount of waste produced by company A declined slightly by approximately 1. By contrast, both company B and C experienced a moderate rise of nearly 2 in 2005.
The amount of waste released by company A had stood at 11 by 2005 and dropped considerablely by nearly 3 during the following 10 years. In 2005, the figure for company B peaked at nearly 10 before undergoing a dramatical decrease of 7 at the end of period. Meanwhile, a significant climb of 4 was recorded in the amount of waste produced by company C during a 10 year period from 2005 to 2015.

l.png
