Truc02
Jun 19, 2019
Writing Feedback / Pie charts showing data on British students speaking additional languages [4]
Question:
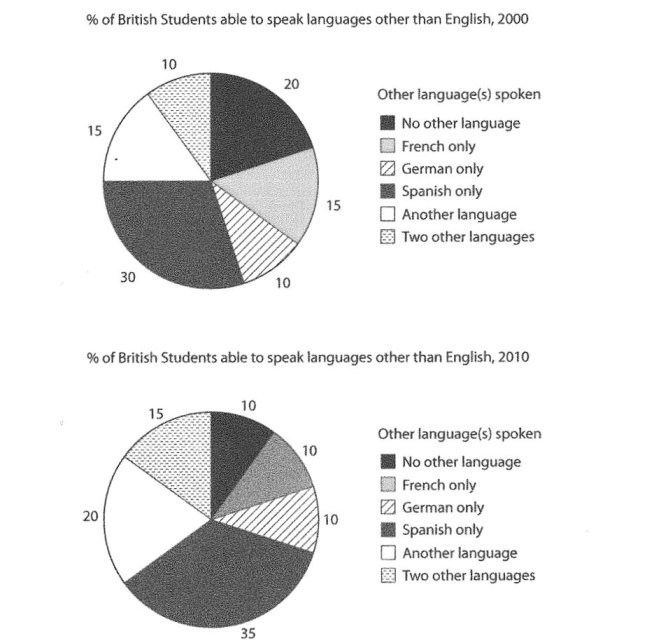
The chart below shows the proportions of British students at one university in England who were able to speak other languages in addition to English, in 2000 and 2010.
Summarize the information by selecting and reporting the main features and make comparisons where relevant.
My writing:
The pie charts illustrate data on British students being able to speak other languages besides English at one tertiary education over a decade since 2000.
Overall, it is clear that while the percentages of those who can speak Spanish, Another language, and Two other languages increased between 2000 and 2010, the opposite trend was true for those of students speaking French and No other language. Moreover, the group of Spanish speaking students was the largest during the given time period.
Looking at the charts more closely, in 2000, the percentage of students speaking Spanish accounted for a third of the total figure, which subsequently went up by 5% in 2010. Similarly, the proportions of bilingual, and multilingual students experienced a rise of 5% between these two years, from 15% to 20%, and 10% to 15% respectively.
In contrast, the percentage of French-speaking students dropped from one-fifth to 10% between 2000 and 2010. In the meantime, the figure for monolingual students declined by half.
The proportion of German-speaking students remained stable at 10% throughout the decade.
Question:
The chart below shows the proportions of British students at one university in England who were able to speak other languages in addition to English, in 2000 and 2010.
Summarize the information by selecting and reporting the main features and make comparisons where relevant.
The proportion of multilingual students in England
My writing:
The pie charts illustrate data on British students being able to speak other languages besides English at one tertiary education over a decade since 2000.
Overall, it is clear that while the percentages of those who can speak Spanish, Another language, and Two other languages increased between 2000 and 2010, the opposite trend was true for those of students speaking French and No other language. Moreover, the group of Spanish speaking students was the largest during the given time period.
Looking at the charts more closely, in 2000, the percentage of students speaking Spanish accounted for a third of the total figure, which subsequently went up by 5% in 2010. Similarly, the proportions of bilingual, and multilingual students experienced a rise of 5% between these two years, from 15% to 20%, and 10% to 15% respectively.
In contrast, the percentage of French-speaking students dropped from one-fifth to 10% between 2000 and 2010. In the meantime, the figure for monolingual students declined by half.
The proportion of German-speaking students remained stable at 10% throughout the decade.

ielts11test2task.jpg
