mywritingsTT
Feb 4, 2020
Writing Feedback / IELTS task 1- The places visited by different people living in Canada. [7]
Hello everyone
I appreciate your feedback and answers
In this essay, I tried to write a paragraph for each groups like bellow:
Paragraph 1: Introduction and overview
Paragraph 2: Born in Canada
Paragraph 3: New migrants born in English-speaking countries
Paragraph 4: New migrants born in other countries
Do you think the way I grouped them is a good idea please?
................................................................................................................................
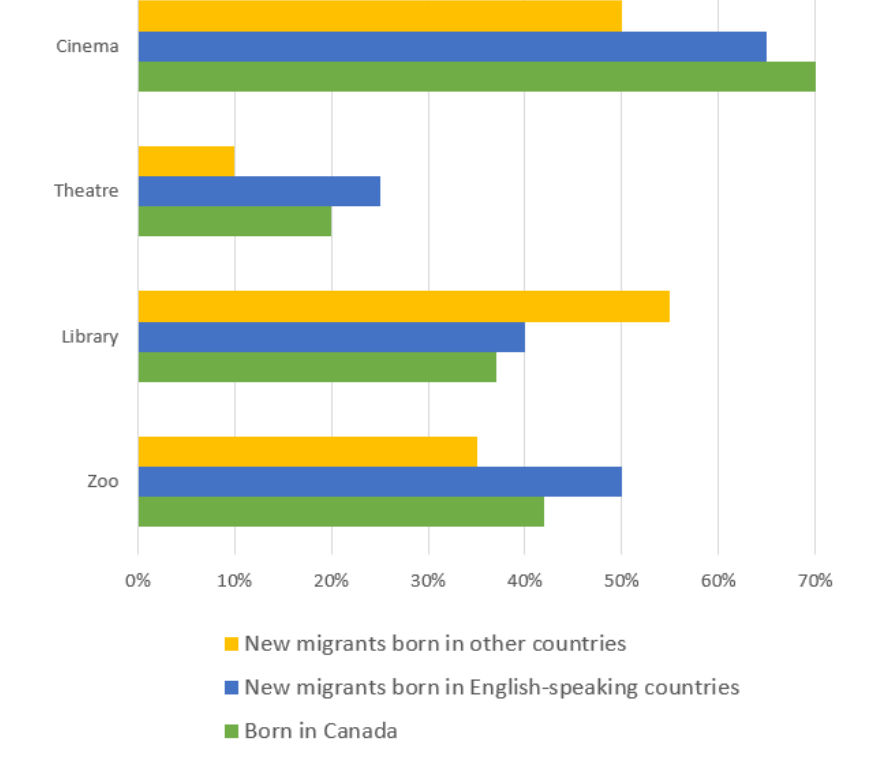
The bar chart illustrates three groups' of people favorite places which are Cinema, theater library and zoo. Overall, all the three groups of people prefer visiting library more than the other three places, while they all like visiting the theater the least. The numbers are given in percentages.
Native Canadian's favorite place is cinema where %70 of them visited, while the least place the want to visit is theater which comprises 20%. After them come zoo and library that takes almost 42% and nearly 38$ respectively.
New English-speaking migrant's favorite place is the cinema that covers 50%, in contrast, only about 28% of them want to spend time in the theater. When it comes to the library and the zoo, the percentage is 40 and 50 in succession.
Non-English-speaking migrants would like to head to the library more than anywhere else which can be seen in the large percentage of about %55, while merely 10% go to the theater. In addition to that, 50% of them like the cinemas, and approximately 30% of their visits is directed to the zoos.
180 words
the popularity of four types attractions among canadians
Hello everyone
I appreciate your feedback and answers
In this essay, I tried to write a paragraph for each groups like bellow:
Paragraph 1: Introduction and overview
Paragraph 2: Born in Canada
Paragraph 3: New migrants born in English-speaking countries
Paragraph 4: New migrants born in other countries
Do you think the way I grouped them is a good idea please?
................................................................................................................................
The bar chart illustrates three groups' of people favorite places which are Cinema, theater library and zoo. Overall, all the three groups of people prefer visiting library more than the other three places, while they all like visiting the theater the least. The numbers are given in percentages.
Native Canadian's favorite place is cinema where %70 of them visited, while the least place the want to visit is theater which comprises 20%. After them come zoo and library that takes almost 42% and nearly 38$ respectively.
New English-speaking migrant's favorite place is the cinema that covers 50%, in contrast, only about 28% of them want to spend time in the theater. When it comes to the library and the zoo, the percentage is 40 and 50 in succession.
Non-English-speaking migrants would like to head to the library more than anywhere else which can be seen in the large percentage of about %55, while merely 10% go to the theater. In addition to that, 50% of them like the cinemas, and approximately 30% of their visits is directed to the zoos.
180 words

bar1.PNG
