Tphuc
Apr 7, 2020
Writing Feedback / Australia physical activity - (Task 1 in IELTS writing test) [2]
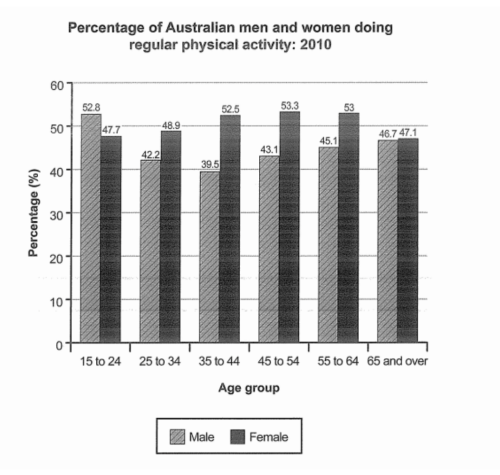
The bar chart shows the percentage of Australian men and women in different age groups who did regular physical activity in 2010
Summarise the information by selecting and reporting the main features, and make comparisons where relevant
The diagram shows the levels of regular physical activity of Australian men and women, separated by age, in 2010.
Overall, there was an opposing trend between the percentage of men and women. However, the pattern differs between the three age groups before 45 and the remaining groups after the age of 45.
The first three age groups saw a downward trend in men's figure, which decreased 13.3%, from 52.8% in the 15 - 24 category to the lowest figure of the chart: 39.5% in the age group of 35 - 44. Meanwhile, the percentage of women doing regular physical activity in these age groups rose from 47.7% to 52.5%.
The trend of the percentage of men and women started to switch places after the age of 45. Women 45 - 54 years of age have the highest percentage with 53.3% but eventually decreased to 47.1% after the age of 65. Finally, the men of the age groups after 45 displayed the slightly increased of 3.6%, from 43.1% to 46.7%.
(166 words)
Thank you very much.
the levels of regular physical activity of people in Australia
The bar chart shows the percentage of Australian men and women in different age groups who did regular physical activity in 2010
Summarise the information by selecting and reporting the main features, and make comparisons where relevant
The diagram shows the levels of regular physical activity of Australian men and women, separated by age, in 2010.
Overall, there was an opposing trend between the percentage of men and women. However, the pattern differs between the three age groups before 45 and the remaining groups after the age of 45.
The first three age groups saw a downward trend in men's figure, which decreased 13.3%, from 52.8% in the 15 - 24 category to the lowest figure of the chart: 39.5% in the age group of 35 - 44. Meanwhile, the percentage of women doing regular physical activity in these age groups rose from 47.7% to 52.5%.
The trend of the percentage of men and women started to switch places after the age of 45. Women 45 - 54 years of age have the highest percentage with 53.3% but eventually decreased to 47.1% after the age of 65. Finally, the men of the age groups after 45 displayed the slightly increased of 3.6%, from 43.1% to 46.7%.
(166 words)
Thank you very much.

6a0120a5bb05d8970c02.png
