jaynguyen
Jul 24, 2021
Writing Feedback / IELTS WRITING TASK 1 - The chart shows the percentage of women and men in one Asian country who pass [3]
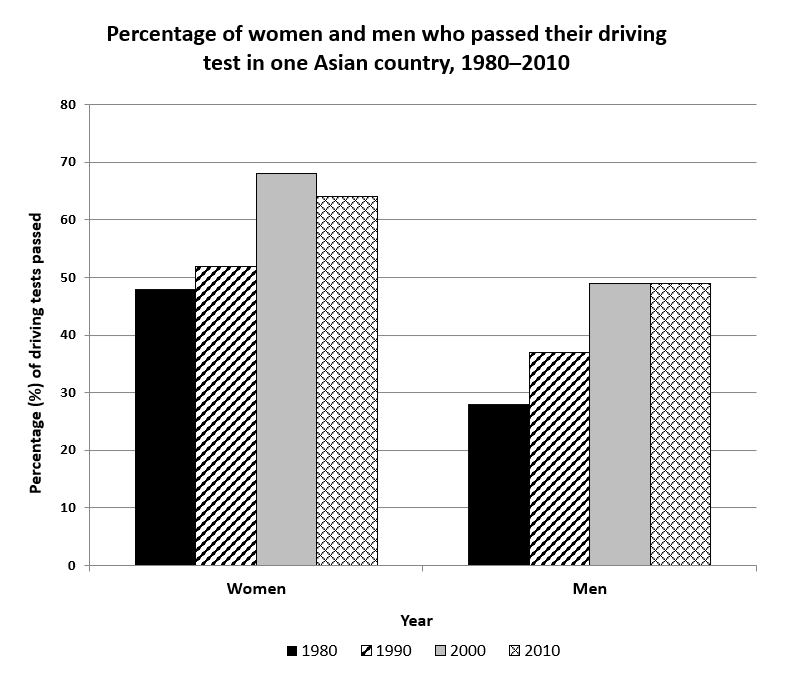
The chart shows the percentage of women and men in one Asian country who passed when they took their driving test between 1980 and 2010.
Summarise the information by selecting and reporting the main features, and make comparisons where relevant.
You should spend about 20 minutes on this task.
The bar graph shows the proportion of each gender who got a driver's license from 1980 to 2010 in one Asian country.
Overall, it is clear that the percentage of women who passed their driving test was higher than that of men over the period of 40 years. In both genders, these figures were low in the first 20 years of the period and increased gradually between 2000 to 2010.
Looking at the graph more closely, one can see that the proportion of women who got driving licenses was lowest in 1980, just nearly 48%. In the next ten years, the number of women who passed the driving test went up moderately by roughly 4%. This figure reached the highest of 68% in 2000 and declined slightly to 65% in 2010.
The similar pattern was seen on the percentage of men who got drive's license between 1980 to 1990. In 1980, the pass driving rate of men was nearly 28% and then this figure grew up by 10% in 1990. Ten years later, the number peaked at nearly 50% and then maintain stability this number to 2010.
driving test pass rates in asia
The chart shows the percentage of women and men in one Asian country who passed when they took their driving test between 1980 and 2010.
Summarise the information by selecting and reporting the main features, and make comparisons where relevant.
You should spend about 20 minutes on this task.
The bar graph shows the proportion of each gender who got a driver's license from 1980 to 2010 in one Asian country.
Overall, it is clear that the percentage of women who passed their driving test was higher than that of men over the period of 40 years. In both genders, these figures were low in the first 20 years of the period and increased gradually between 2000 to 2010.
Looking at the graph more closely, one can see that the proportion of women who got driving licenses was lowest in 1980, just nearly 48%. In the next ten years, the number of women who passed the driving test went up moderately by roughly 4%. This figure reached the highest of 68% in 2000 and declined slightly to 65% in 2010.
The similar pattern was seen on the percentage of men who got drive's license between 1980 to 1990. In 1980, the pass driving rate of men was nearly 28% and then this figure grew up by 10% in 1990. Ten years later, the number peaked at nearly 50% and then maintain stability this number to 2010.

3a99ec43c6524c638.png

