anthonyphan
May 3, 2020
Writing Feedback / IELTS PIE CHART: The graphs compare the different types of energy manufacture of France [2]
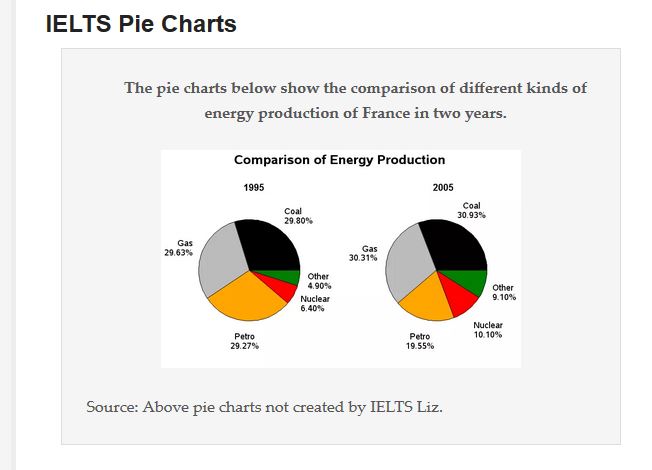
The graphs compare the different types of energy manufacture of France in 1995 and 2005.
Overall, Using Coal, gas, and petro to produce energy account for the largest proportion of productions in both years. On the other hand, Nuclear energy production accounts for the least.
The percentage of Coal energy production in 1995 and 2005 are 29.80% and 30.93% respectively. Likewise, the proportion of Gas energy production in 1995 increased from 29.63% to 30.31% in 2005. However, in the same period, The ratio of Petro energy production in 1995 decreased from 29.27% to just 19.55%.
The percentage of Nuclear and other energy production both increased, Nuclear energy production increased from 6.4% in 1995 to 10.10% in 2005, other energy production increased from 4.9% to 9.1%.
There is a clear trend that Energy production shifts from the conventional way of create energy to some modern way of doing it.
Comparison of energy production
The graphs compare the different types of energy manufacture of France in 1995 and 2005.
Overall, Using Coal, gas, and petro to produce energy account for the largest proportion of productions in both years. On the other hand, Nuclear energy production accounts for the least.
The percentage of Coal energy production in 1995 and 2005 are 29.80% and 30.93% respectively. Likewise, the proportion of Gas energy production in 1995 increased from 29.63% to 30.31% in 2005. However, in the same period, The ratio of Petro energy production in 1995 decreased from 29.27% to just 19.55%.
The percentage of Nuclear and other energy production both increased, Nuclear energy production increased from 6.4% in 1995 to 10.10% in 2005, other energy production increased from 4.9% to 9.1%.
There is a clear trend that Energy production shifts from the conventional way of create energy to some modern way of doing it.

Piechart1.JPG

