Hieu nguyen trog
Sep 16, 2020
Writing Feedback / The bar chart illustrates the number of people who decide on university subjects chosen in 2005 [4]
Please help me to check this , thank you
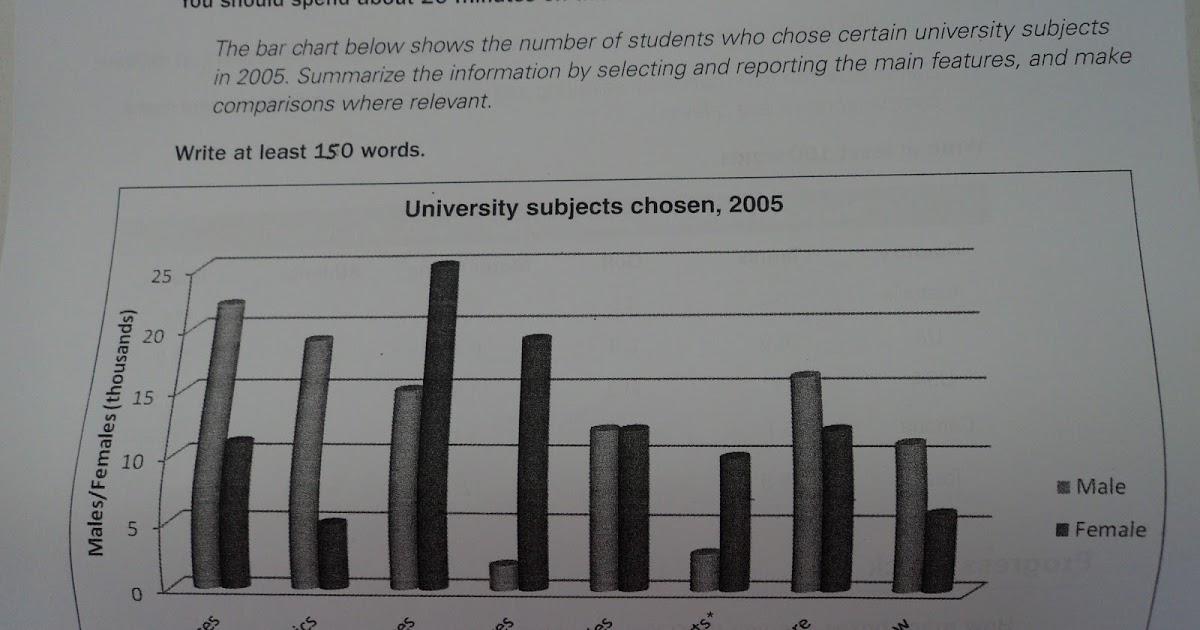
This bar chart illutrates the people who decide on university subjects chosen in 2005. There are clear differences between male and female students
It is evident that female chose languages and arts than male. In addition, humanities has the same learners
Regarding social sciences, the number of female students have chose this subject, over 25 thounsands, which has higher than male students, about 15 thounsands. Morever, a lot of female students with languages chosen from the high number of nearly 20 thounsands while this subject is significantly lower in male, only under 5 thounsands
When it comes to arts, not as many students chose this subject, only under 5 thounsands in male and nearly 10 thounsands in female
Hope all of you reply this soon
Thank you very much
❤️❤️❤️
Please help me to check this , thank you
Bar chart about university subjects chosen
This bar chart illutrates the people who decide on university subjects chosen in 2005. There are clear differences between male and female students
It is evident that female chose languages and arts than male. In addition, humanities has the same learners
Regarding social sciences, the number of female students have chose this subject, over 25 thounsands, which has higher than male students, about 15 thounsands. Morever, a lot of female students with languages chosen from the high number of nearly 20 thounsands while this subject is significantly lower in male, only under 5 thounsands
When it comes to arts, not as many students chose this subject, only under 5 thounsands in male and nearly 10 thounsands in female
Hope all of you reply this soon
Thank you very much
❤️❤️❤️

39773C577EB445EA8.jpeg
