Phuongtam
Feb 27, 2021
Writing Feedback / Average annual expenditure on cell phone, national and international fixed-line services, 2001-2010 [2]
Give me some advice! Thank a lot!
PHONE CALLS EXPENSES
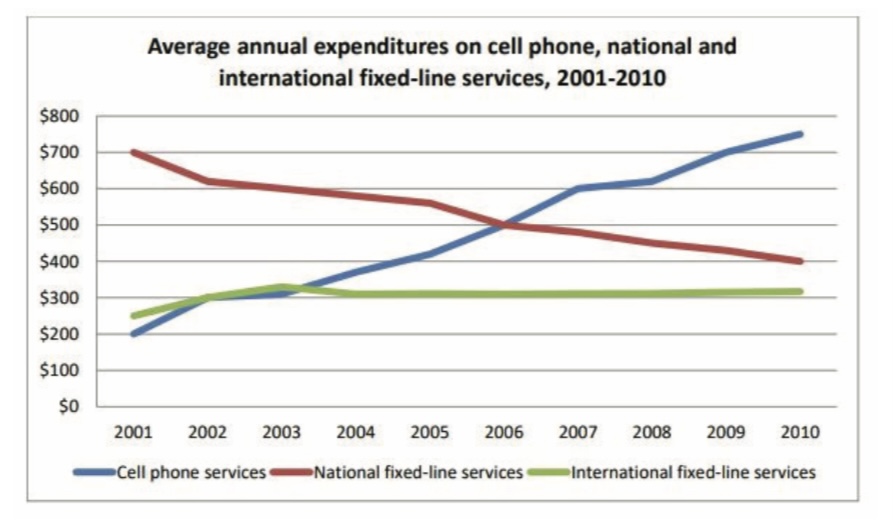
The line graph illustrates on average how much money was spent annually on cell phone,national and international fixed-line services in the USA over a period of 9 years,starting in 2001.
It is clear that the average amount of money spent yearly on national fixed-line services declined, while the figure for cell phone services increased considerably during the period shown. Furthermore, customers spent the lest money on international fixed-line services in general.
In 2001, the average annual expenditures on national fixed-line services was $700,while the figure for cell phone and international fixed-line services were $200 and $250 respectively. Over the following 5 years, both mobile phone and national fixed-line services were spent the same amount of money,at $500, while the figure for global fixed-line services went up steadily.
From 2006 to 2010,the expenses on cell phone services experienced an upward trend to about $750. By contrast, the figure for global fixed-line services dropped exponentially down to $400. The average amount of money spent on international fixed-line services remained relatively stable during the period, around $300.

337484_1_o.jpeg
