My Nguyen
Jun 2, 2021
Writing Feedback / The comparison of total water utilized for different purposes in Sydney between 1997 and 2007 [2]
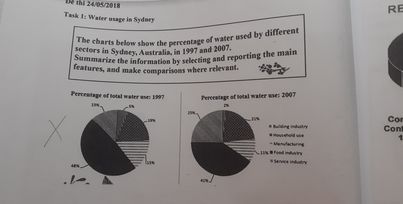
A glance at two pie charts provided reveals a sharp comparison of total water utilized for different purposes in Sydney between 1997 and 2007. Overall, the highest water consumed amount was accounted by food industry while the least belonged to building industry.
In 1997, the amount of water made use of for food industry was nearly half compared to the total. At the opposite end of scale, the data for building industry was the most insignificant number with 5%. Meanwhile, the percentage of household use, manufacturing and service industry can be grouped into the range from 13% to 19%.
Interestingly, food industry's consumed amount witnessed a recessive growing pattern by 7% to 41% after a decade despite maintaining its crown throughout the given period. The same picture was observed in the amount of water used for manufacturing from 15% to over 10%. The data of service industry went up dramatically to 25% which doubled itself in the year 1997, narrowly followed by a slight growth from 19% to 21% of family use's proportion. On the contrary, there was a minimal deterioration experienced by 3% in the figure for building industry,
Water Usage in Sydney. (WRITING TASK1)
A glance at two pie charts provided reveals a sharp comparison of total water utilized for different purposes in Sydney between 1997 and 2007. Overall, the highest water consumed amount was accounted by food industry while the least belonged to building industry.
In 1997, the amount of water made use of for food industry was nearly half compared to the total. At the opposite end of scale, the data for building industry was the most insignificant number with 5%. Meanwhile, the percentage of household use, manufacturing and service industry can be grouped into the range from 13% to 19%.
Interestingly, food industry's consumed amount witnessed a recessive growing pattern by 7% to 41% after a decade despite maintaining its crown throughout the given period. The same picture was observed in the amount of water used for manufacturing from 15% to over 10%. The data of service industry went up dramatically to 25% which doubled itself in the year 1997, narrowly followed by a slight growth from 19% to 21% of family use's proportion. On the contrary, there was a minimal deterioration experienced by 3% in the figure for building industry,

IE.jpg
