hoangdepzai3904
Sep 9, 2021
Writing Feedback / The global water use and the water expenditure in Brazil and Democratic Republic of Congo [3]
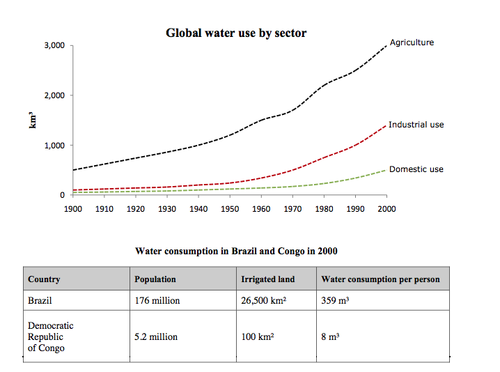
The charts below illustrate the amount of the global water use and the water expenditure in Brazil and Democratic Republic of Congo.
Overall, from 1900 to 2000, it is easy to see that the global water needs rose significantly, especially in agriculture which had the highest number in the amount of water use. We can also see that the proportion of water expenditure is dramatically higher in Brazil than in Congo.
In the first chart, the agriculture had a significant increase in water use from 500km3 to 1000km3 between 1900 and 1950, and then it continued its upward trend to reach a peak at 3000 inn 2000. While from 1900 to 1950, the industrial use and domestic use had a mild fluctuation in water needs, just nearly 1 km3, however, between 1950 and 2000, it increase swiftly to 1000km in industrial and under 500km3 in domestic.
In the second chart, in 2000, the population of Brazil was 176 million and the population of Congo was 5.2 million. Brazil's water consumption, at 359km3, was much higher than Congo, at 8km3, it can be explained by the fact that irrigated land in brazil was 256 times higher than in Congo.
water use worldwide and water consumption in two nations
The charts below illustrate the amount of the global water use and the water expenditure in Brazil and Democratic Republic of Congo.
Overall, from 1900 to 2000, it is easy to see that the global water needs rose significantly, especially in agriculture which had the highest number in the amount of water use. We can also see that the proportion of water expenditure is dramatically higher in Brazil than in Congo.
In the first chart, the agriculture had a significant increase in water use from 500km3 to 1000km3 between 1900 and 1950, and then it continued its upward trend to reach a peak at 3000 inn 2000. While from 1900 to 1950, the industrial use and domestic use had a mild fluctuation in water needs, just nearly 1 km3, however, between 1950 and 2000, it increase swiftly to 1000km in industrial and under 500km3 in domestic.
In the second chart, in 2000, the population of Brazil was 176 million and the population of Congo was 5.2 million. Brazil's water consumption, at 359km3, was much higher than Congo, at 8km3, it can be explained by the fact that irrigated land in brazil was 256 times higher than in Congo.

BrazilCongoWater.png
