phienn
Oct 29, 2021
Writing Feedback / Ielts - The chart gives information about water use by sector in Brazil and Congo [3]
Ans:
The chart gives information about water use by sector agriculture, industrial use, domestic use and water consumption in two countries Brazil and Democratic Republic of Congo.
Overall, the amount of using water in Agriculture from 1900 to 2000 is larger proportion than Industrial use and Domestic use. We also can see that the water consumption per person in Brazil is higher than Democratic Republic of Congo.
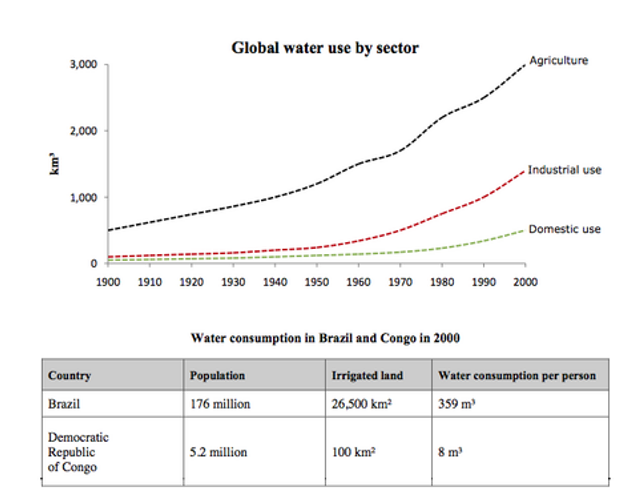
In 1900, the proportion of Industrial use and Domestic use are only at about one-tenth of 1000km3 of water use by sector. While Agriculture is accounts for 500km3 of water use by sector from the chart. By 2000 had risen significantly in three sectors, but Agriculture still highest, peaked at 3000km3, while Industrial use had risen under 2000km3, only about 1200km3 and Domestic use is the lowest sector, had risen slowly approximately 500km3.
In the year 2000, the population in Brazil and Congo were 176 million and 5.2 million respectively. So the water consumption per person in Brazil is higher than in Congo, at 359m3 and 8m3 respectively. This could be explained by the fact that Brazil had 265 times more than Congo in irrigated land.
The graph and table below give information about water use worldwide and water consumption in two different countries.
Ans:
The chart gives information about water use by sector agriculture, industrial use, domestic use and water consumption in two countries Brazil and Democratic Republic of Congo.
Overall, the amount of using water in Agriculture from 1900 to 2000 is larger proportion than Industrial use and Domestic use. We also can see that the water consumption per person in Brazil is higher than Democratic Republic of Congo.
In 1900, the proportion of Industrial use and Domestic use are only at about one-tenth of 1000km3 of water use by sector. While Agriculture is accounts for 500km3 of water use by sector from the chart. By 2000 had risen significantly in three sectors, but Agriculture still highest, peaked at 3000km3, while Industrial use had risen under 2000km3, only about 1200km3 and Domestic use is the lowest sector, had risen slowly approximately 500km3.
In the year 2000, the population in Brazil and Congo were 176 million and 5.2 million respectively. So the water consumption per person in Brazil is higher than in Congo, at 359m3 and 8m3 respectively. This could be explained by the fact that Brazil had 265 times more than Congo in irrigated land.

Screenshot_4.png
