phuong171100
Mar 27, 2022
Writing Feedback / Consumption of chicken - IELTS WRITTING TASK 1: LINE GRAPH [2]
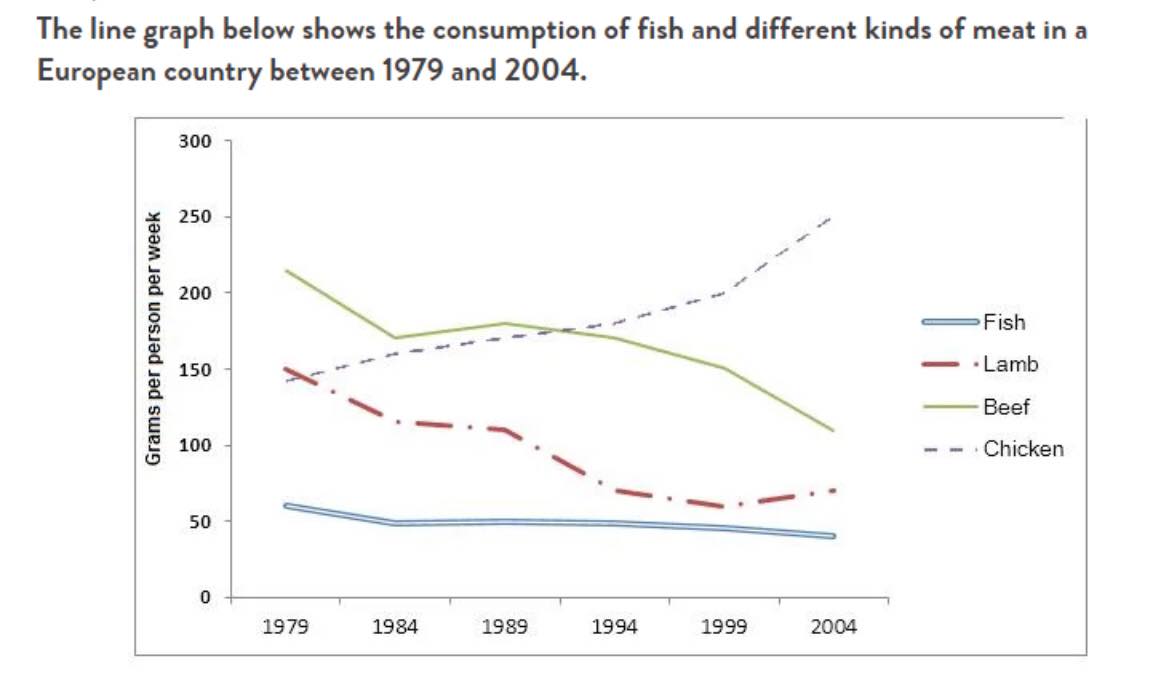
The line graph illustrates the amount of fish and various types of meat in European nation over a period of twenty-five years.
Overall, there was a considerable increase in the amount of chicken consumed, and in addition to this, the European expended the least on fish during the examined period.
In 1979, around 220 grams of beef was consumed while the consumption of chicken and lamp were nearly 150 grams. In contrast, many Europeans chose negligible amount of fish which its figure was approximately 52 grams. Over the following five years, it is clear that various kinds of meat such as beef and lamp saw a downward trend, around 160 grams and 120 grams respectively. The amount of fish also declined slightly below 50 grams. In contrast, the consumption of chicken had a gradual rise by 10 grams per week.
Between 1984 and 2004, the consumption of chicken experienced a significant surge and overtook other nutrition as the primary nourishment in Europe, before reaching the peak at 250 grams. Reversely, beef and lamp consumption fell rapidly which its respective figures were approximately 120 grams and 52 grams only. The expenditure on fish stabilized at the number of European consumers over the last years.
the consumption of fish and different kinds of meat
The line graph illustrates the amount of fish and various types of meat in European nation over a period of twenty-five years.
Overall, there was a considerable increase in the amount of chicken consumed, and in addition to this, the European expended the least on fish during the examined period.
In 1979, around 220 grams of beef was consumed while the consumption of chicken and lamp were nearly 150 grams. In contrast, many Europeans chose negligible amount of fish which its figure was approximately 52 grams. Over the following five years, it is clear that various kinds of meat such as beef and lamp saw a downward trend, around 160 grams and 120 grams respectively. The amount of fish also declined slightly below 50 grams. In contrast, the consumption of chicken had a gradual rise by 10 grams per week.
Between 1984 and 2004, the consumption of chicken experienced a significant surge and overtook other nutrition as the primary nourishment in Europe, before reaching the peak at 250 grams. Reversely, beef and lamp consumption fell rapidly which its respective figures were approximately 120 grams and 52 grams only. The expenditure on fish stabilized at the number of European consumers over the last years.

Here's the topic
