Rosalie Yang
Apr 12, 2022
Writing Feedback / The differences in ownership of technology devices and the number of hours spent doing households [2]
IELTS WRITING Task 1
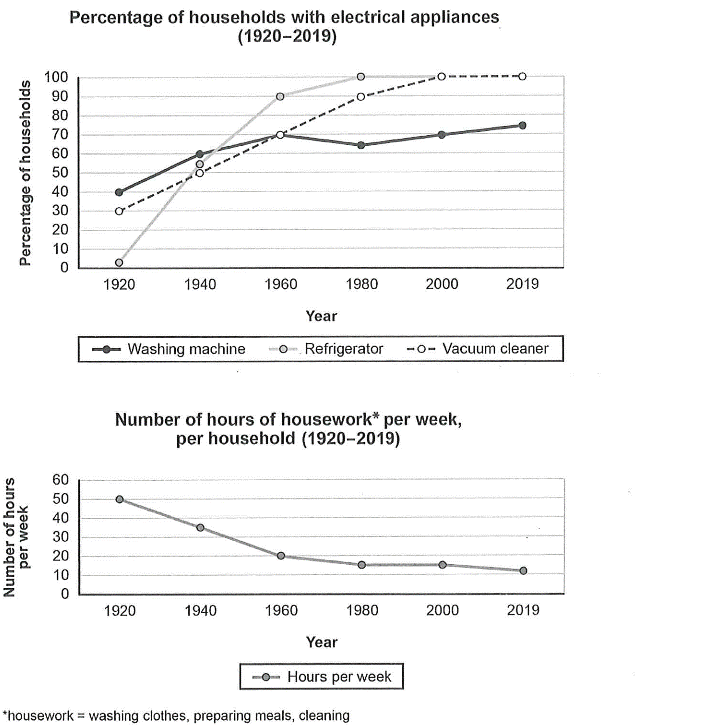
The charts below show the changes in ownership of electrical appliances and amount of time doing housework and households in one country between 1920 and 2019.
The charts illustrated the differences in ownership of technology devices and the number of hours spent doing households in one country from 1920 to 2019.
Overall, it can be seen from the charts that the usage of refrigerators for housework was not popular in 1920 while the proportion of these appliances occupied the first rank in 2019. Besides, the amount of time of weekly households reduced dramatically in the period of 100 years.
In 1920, there was only about 3% of households used refrigerators while the percentage using a vacuum was 10 times it. The figure for the usage of washing machines was 40% and increased for a 40-year period. In 1960, this static declined from 70% to 65%, prior to a continuous rise for the rest of this period and reaching 75% in 2019. Meanwhile, the percentage of the usage of households with vacuum cleaners and refrigerators grew generally and in 2019, every family in this country was using those kinds of electrical appliances.
People were likely to spend less time doing their housework. In 1920, the citizen spent 50 hours per week and this figure decreased dramatically to 20 hours in 1960. The time kept declining until it was only 11 hours in 2019.
IELTS WRITING Task 1
The charts below show the changes in ownership of electrical appliances and amount of time doing housework and households in one country between 1920 and 2019.
Summarise the information by selecting and reporting the main features, and make comparisons where relevant.
The charts illustrated the differences in ownership of technology devices and the number of hours spent doing households in one country from 1920 to 2019.
Overall, it can be seen from the charts that the usage of refrigerators for housework was not popular in 1920 while the proportion of these appliances occupied the first rank in 2019. Besides, the amount of time of weekly households reduced dramatically in the period of 100 years.
In 1920, there was only about 3% of households used refrigerators while the percentage using a vacuum was 10 times it. The figure for the usage of washing machines was 40% and increased for a 40-year period. In 1960, this static declined from 70% to 65%, prior to a continuous rise for the rest of this period and reaching 75% in 2019. Meanwhile, the percentage of the usage of households with vacuum cleaners and refrigerators grew generally and in 2019, every family in this country was using those kinds of electrical appliances.
People were likely to spend less time doing their housework. In 1920, the citizen spent 50 hours per week and this figure decreased dramatically to 20 hours in 1960. The time kept declining until it was only 11 hours in 2019.

51.png
