An99
May 13, 2022
Writing Feedback / The line graph show the oil production and consumption in China between 1982 and 2006 [2]
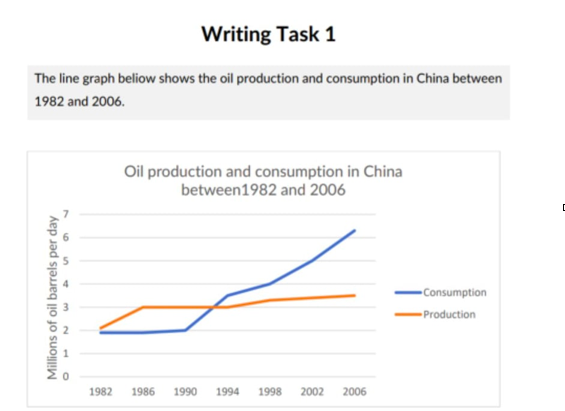
The graph demonstrates the figures for oil which was consumed and produced in China over the course of 24 years from 1982 to 2006.
Overall, it is obvious that there was an upward trend in China's oil consumption and production over the years. However, the rising speed of consumption was much faster than that of production.
At the year of 1982 the figures for oil consumption and production were fairly equal at 2 million barrels per day. However, while the rate of oil consumption remained unchanged over 8 years at the figures around 2 million barrels per day, oil production witnessed a significant upward trend to 3 million barrels per day before staying constant until 1990.
From 1990 to 2006, the amount of oil that was consumed made a breakthrough and reached the peak at 6 million in 2006. Meanwhile, the figures for oil production continued to increase, but only marginally and finally end up at to approximately 3.5 million barrels per day, which was 3.5 times smaller than that of consumption.

ScreenShot202205.png