Cheng_ting
Jul 8, 2022
Writing Feedback / Ielts Task 1 - The graph represents how much money was spent on meat and fish in a European country [2]
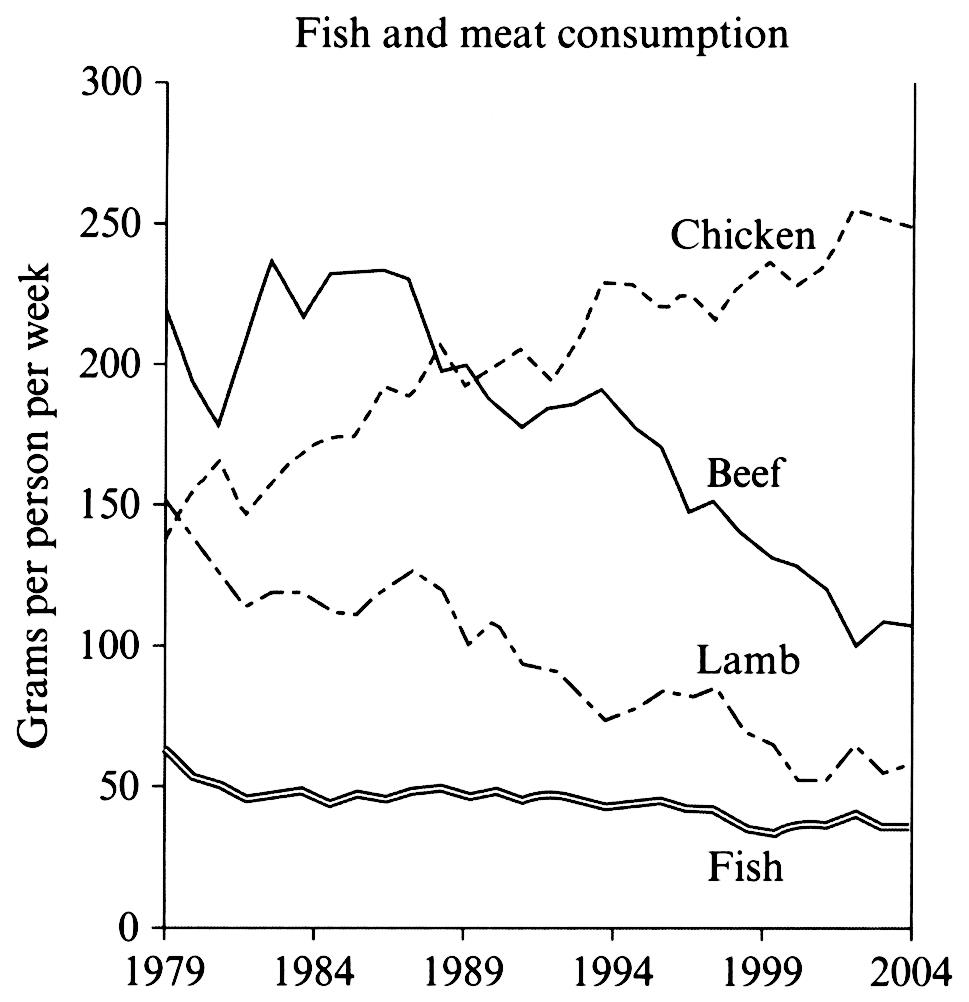
The graph below shows the consumption of fish and some different kinds of meat in a European country between 1979 and 2004.
Summarise the information by selecting and reporting the main features, and make comparisons where relevant.
The line graph represent the how many people spend the money on 4 different kind of meat in a European country over a period of 25 years.
It is clear that the chicken meat of spending was increased and it had highest figure by 2004, while beef was dramatically fall, it just about over 100 per person a week.
By 1979, the number of chicken started to rising, the number overtake the lamb and beef in about 10 years, and rise from around 150 to just under 250 per person per week between 1979 and 2004. In contrast, the figures of beef and lamb was noticeable decreasing about under 150 and 100 per person per week between 1979 and 2004.
While, the fish meat were the lowest number, and it were the most stable figure in the graph, around 50 per person per week in this period of 25 years.
fish and meat consumption
The graph below shows the consumption of fish and some different kinds of meat in a European country between 1979 and 2004.
Summarise the information by selecting and reporting the main features, and make comparisons where relevant.
The line graph represent the how many people spend the money on 4 different kind of meat in a European country over a period of 25 years.
It is clear that the chicken meat of spending was increased and it had highest figure by 2004, while beef was dramatically fall, it just about over 100 per person a week.
By 1979, the number of chicken started to rising, the number overtake the lamb and beef in about 10 years, and rise from around 150 to just under 250 per person per week between 1979 and 2004. In contrast, the figures of beef and lamb was noticeable decreasing about under 150 and 100 per person per week between 1979 and 2004.
While, the fish meat were the lowest number, and it were the most stable figure in the graph, around 50 per person per week in this period of 25 years.

1558333804073150.jpg
