Lemonsiuer
Sep 13, 2022
Writing Feedback / The graph below shows the employment rate of each gender in four different countries in 2002. [2]
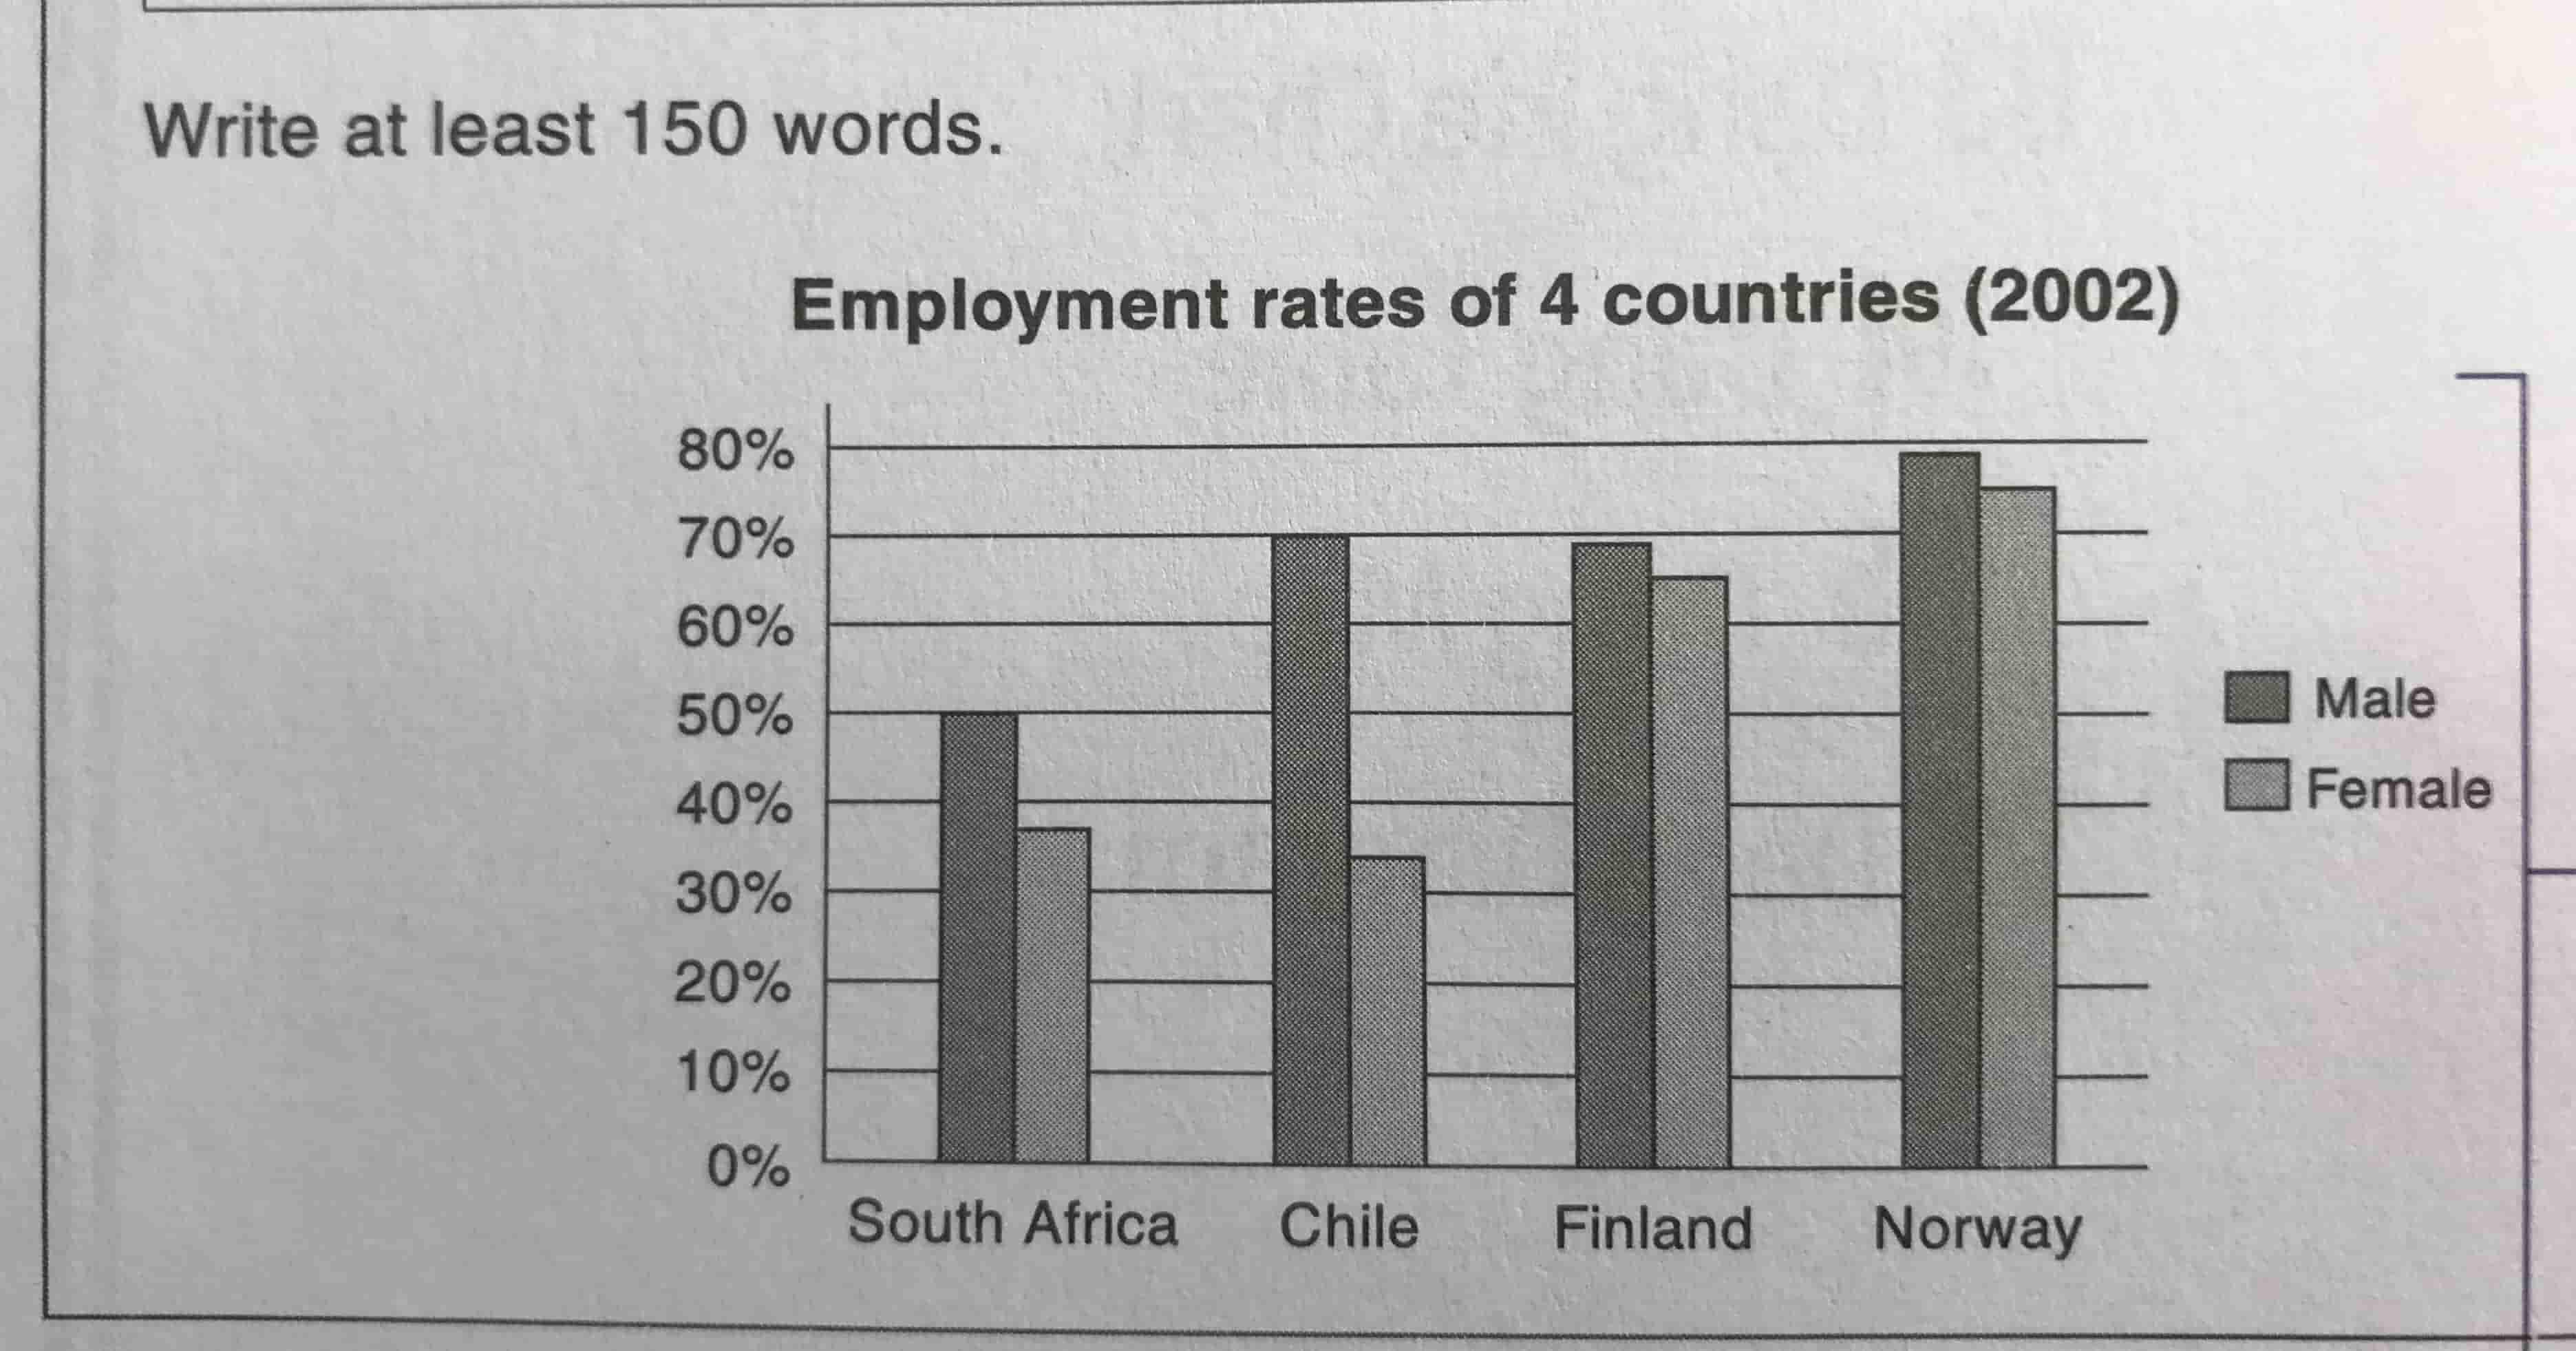
The bar graph below shows the employment rates of men and women in four different countries, South Africa, Chile, Finland, Norway in 2002.
Overall, it is clear that the proportion of men working is always higher than women in four countries. It is also evidence that the employment figures in both Finland and Norway of the two sexes is relatively close. The opposite is true in Chile where the employment percentage has the biggest gap between the two genders.
Looking at the bar graph more closely, one can see that nearly 80 percent in Norway were in work, which makes them the group with the highest employment rate out of the four countries. Chile and Finland followed closed behind at roughly 70 percent. However, the percentage of South African men that had jobs were low compared to the others countries,at only 50 percent. As was the case with men, Norway also had the highest women employment rate, at above 70 percent. Finland was second with around 67%. The rates in South Africa and Chile were lower, both only has only one-third of women working. Moreover, Chile female employment rate is only half when compared to their counterparts.
employment rates - graph analysis
The bar graph below shows the employment rates of men and women in four different countries, South Africa, Chile, Finland, Norway in 2002.
Overall, it is clear that the proportion of men working is always higher than women in four countries. It is also evidence that the employment figures in both Finland and Norway of the two sexes is relatively close. The opposite is true in Chile where the employment percentage has the biggest gap between the two genders.
Looking at the bar graph more closely, one can see that nearly 80 percent in Norway were in work, which makes them the group with the highest employment rate out of the four countries. Chile and Finland followed closed behind at roughly 70 percent. However, the percentage of South African men that had jobs were low compared to the others countries,at only 50 percent. As was the case with men, Norway also had the highest women employment rate, at above 70 percent. Finland was second with around 67%. The rates in South Africa and Chile were lower, both only has only one-third of women working. Moreover, Chile female employment rate is only half when compared to their counterparts.

Task1Employmentra.jpg
