nateq136
Aug 9, 2024
Writing Feedback / The funding - Summarize the information by selecting and reporting the main features [2]
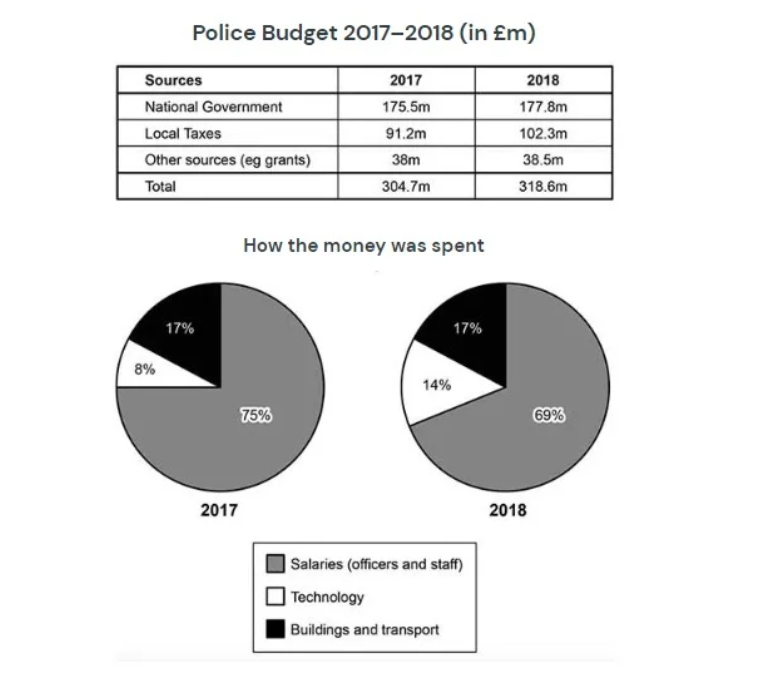
The table presents the funding provided from some sources from 2017 to 2018. The charts show the proportions of funding spent on several fields in the same period.
Overall, the police budget showed an increase in all providing sources, while the national government source contributed over half of the total budget. In terms of money distribution in different fields, the proportion of salaries for staff and officers dominated, whereas the funding for technology still took the least investment
In 2017, the majority of the budget, amounting to 175.5 million, was contributed by the national government. This amount increased steadily to 177.8 million in 2018. Similarly, local taxes provided 91.2 million in 2017, and this figure rose significantly to 102.3 million in 2018, marking the largest growth among all sources. Funding from other sources, such as grants, experienced a slight increase from 38 million in 2018 to 38.5 million in 2018
Regarding the distribution of the budget across different fields, the percentage of salaries for staff and officers remained highest at 75% in 2017, despite a slight decrease of about 6% in 2018. The funding for technology increased by about 6% from 8% in 2017 to 14% in 2018. However, the proportion of funding for buildings and transport remained the same in both 2017 and 2018 at 17%

tablepiechartscam.png
