fedail
Sep 8, 2012
Writing Feedback / IELTS essay; assess this essay and show me my mistakes? [3]
Hello,
Kindly could you help me to assess this essay and show me my mistakes?
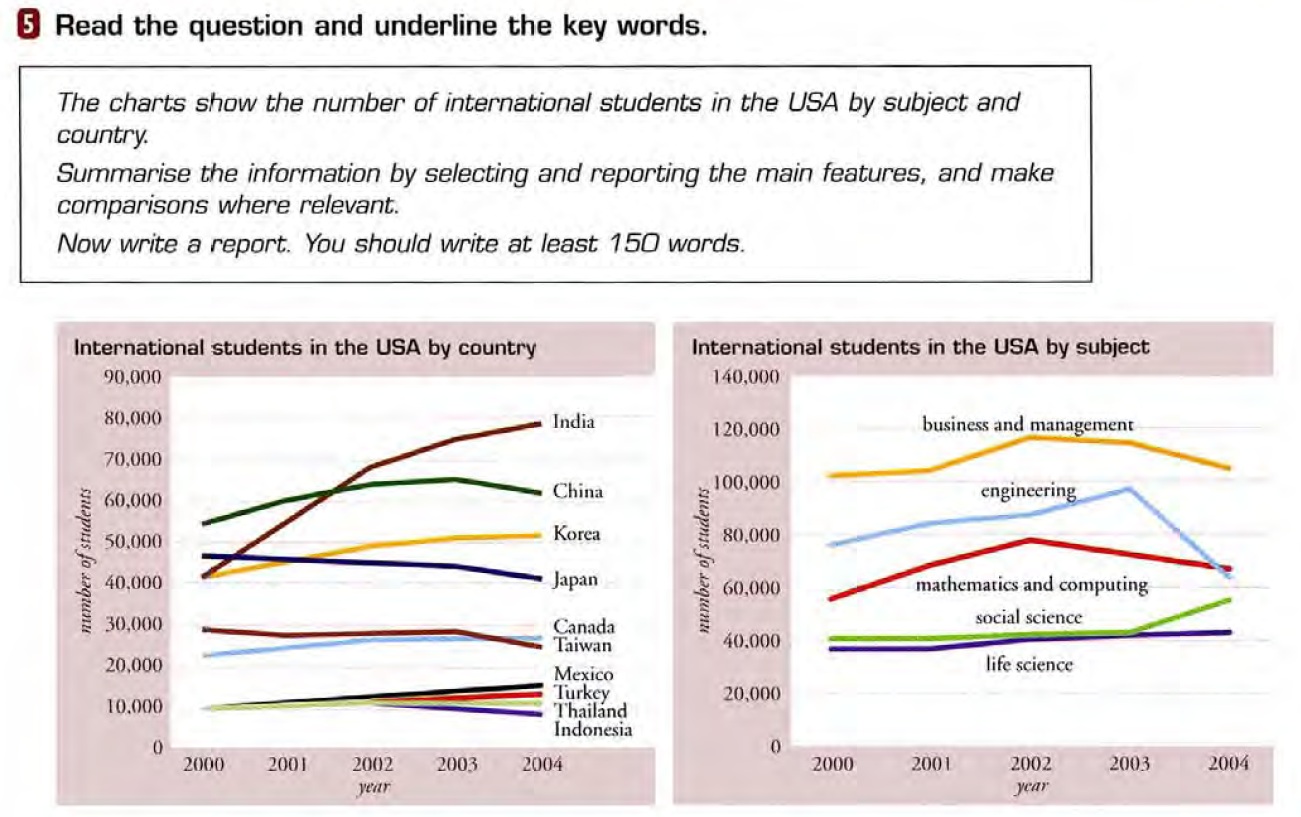
The two line graph charts show the number of Inernational students in the USA by subject and country over a period betwen 2000 and 2004. We can see that the general major of International Students enetering the university from Asia and some other countries like Canada, Turkey and Maxico. In 2000, the highest number was in chinese students with around 55,000. The next highest number was Japan with almost 46,000 followed by Korea and India with around 40,000 each. Then we can see other countries like Canada and Taiwan with a medium ranking in the number of students, while Maxico Turkey Thailand and Indonesia about less than 2000 wich fluctuated about +- 500 over the years between 2002 and 2004. In comparing between India and China we can see that by year 2004 India had an extremely increase in the number of students with 80,000 making china behind in the second place with around 60,000. From the second chart, which gives us the number of International Students by subject, the most popular subject is buisness and managment with a slight increase and fall in 2002 and 2003 respectively. The next most popular subject is engineering study with almost 80,000 in 2000 with slow growth to reach 100,000 in 2003 then with a dramatic fall in 2004 with around 60,000 students, in contrast with mathamatics and computing which rise from just under 60,000 in 2000 to be almost 70,000 in 2004. In comparing between social science and life science we can see that the life science stays the same of the period while social science increased 50% to reach almost 60,000.

Untitled.jpg
