chichiua
Mar 14, 2014
Writing Feedback / Analysis of a questionnaire on kids activities - IELTS writing task 1 sample: Pie Graph [5]
Hi everyone! Please give me some advice and feedback about this essay. I made this to practice for the IELTS exam. This is a sample of writing task 1.
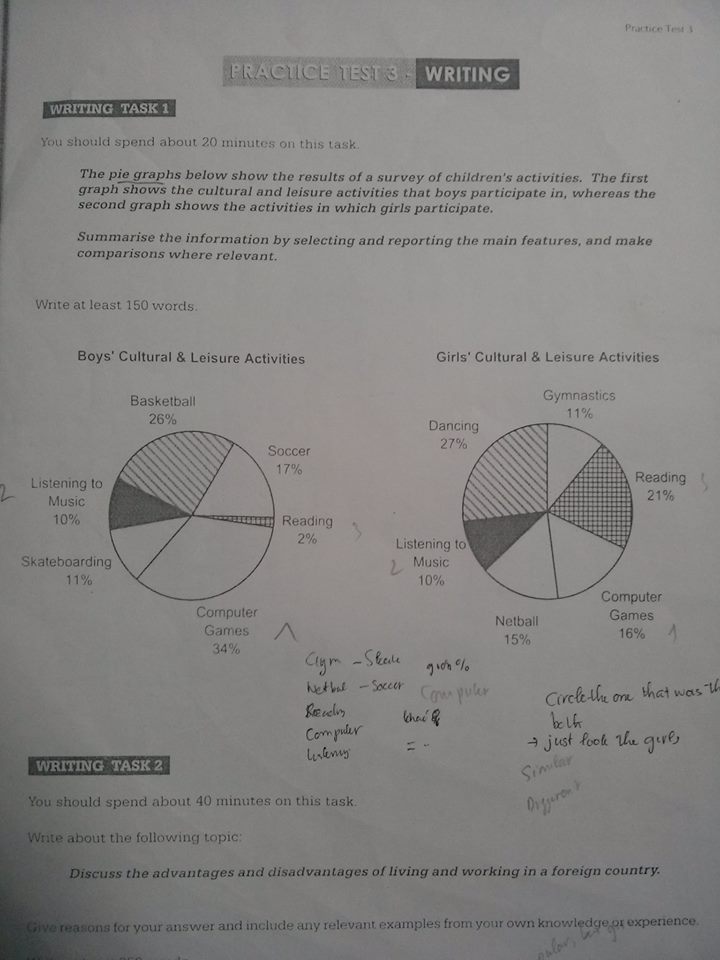
Task Description: The pie graphs below show the result of a survey of children's activities. The first graph shows the cultural and leisure activities that boys participate in, whereas the second graph shows the activities in which the girls participate.
Write a report describing the information shown in the two pie graphs. Write at least 150 words. (The graphs are found at the end of my essay)
Here's my answer:
The two pie charts provided illustrates an analysis of a questionnaire. They show the activities that girls and boys participate in, in percentage times. Overall, it can be seen that equal quantities of both sexes enjoyed listening to music, but a dramatically larger number of girls liked reading, and there were many differences in terms of their preferred sports
A similar proportion of boys and girls enjoy gymnastics and skateboarding respectively (11%). In addition, 15% of girls enjoy Netball while approximately the same percentage of boys enjoy soccer (17%).
In terms of reading, roughly ten times more girls said that they enjoy reading rather than boy (21% and 2%). Approximately twice more boys enjoy computer games than girls (34% and 16%). Roughly a quarter of boys prefer basketball (26%) and listening to music is the smallest but the same proportion (1

992263_7529300613857.jpg
