gggooniel
Apr 1, 2014
Writing Feedback / IELTS; electricity volume for two major seasons in UK [2]
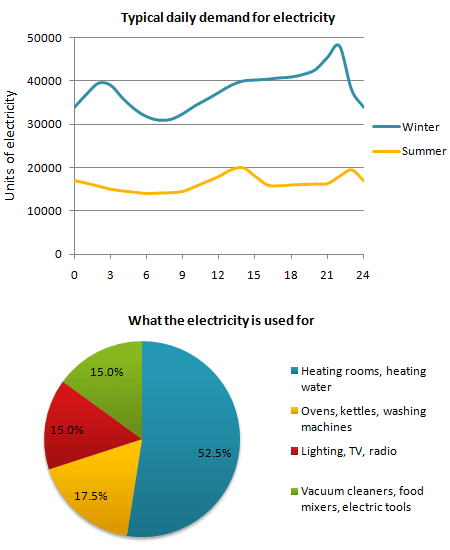
The graphs compare changes in the electricity volume for two major seasons and the proportion of electric energy consumed by the British for four different reasons.
It can be clearly seen that on a daily basis, much more units of electricity are demanded in winter as compared to that in summer. It is also noticeable that the main purpose for utilizing electricity is to heat rooms and water items.
The line graph gives information that the consumption of electricity during the typical winter day ranges from 30000 to 50000, peaking to just under 49000 units at 21.00. While the volume of electricity in summer days changes between about 12000 and 20000 over the 24-hour period. Furthermore the highest units of electricity is experienced at 13.00 and 22.00, with 20000 units.
From a pie chart, about a half of the electric usage is consumed due to heating buildings and water in UK. This figure is threefold higher than the second demanded pattern. Only 17% of overall electricity is used by people for the machines namely, ovens, kittens, washing equipment. Finally, both categories of ''Tv, radio lighting'' and ''vacuum cleaner, mixer, electric tools'' are utilized the same amount of electric power, at 15% on each.

221533_1_o.png
