Alfred557
Aug 17, 2014
Writing Feedback / IELTS - The residents of Edmonton are especially keen on cars [7]
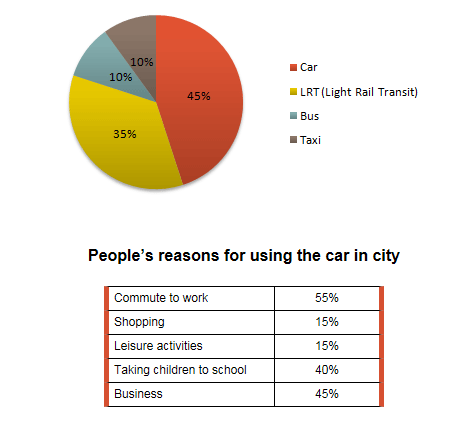
The diagrams below give information on transport and car use in Edmonton. Summarise the information by selecting and reporting the main features, and make comparisons where relevant.
The pie chart compares the percentages of different modes of transportation used in Edmonton. Whilst the table illustrates the main reasons for trvalling by car.
Firstly, it is clear that approximately half of all the people use cars, while around one-third preferred the light rail transit system. However, the figures for travelling by bus and taxi are equally important, reaching 10 per cent for each of these methods.
Also, the foremost reason for using an automobile is commuting to work, at a little over half of the total percentage. Although, it is followed closely by the need to take children from school and business-related activities, being at 40 and 45 per cent respectively. It can be noted that shopping and various lesure activities are the main motivation for 15 per cent of the surveyed populace each.
In conclusion, the residents of Edmonton are especially keen on cars, while they are mainly used for various work issues.
I would like to hear some suggestions for improvement and an orientational band score this report might get. Thanks.

The charts provided
