mkthanh
Dec 13, 2014
Undergraduate / IELTS writing task 1 - Main energy sources for Burnland, 2006 [3]
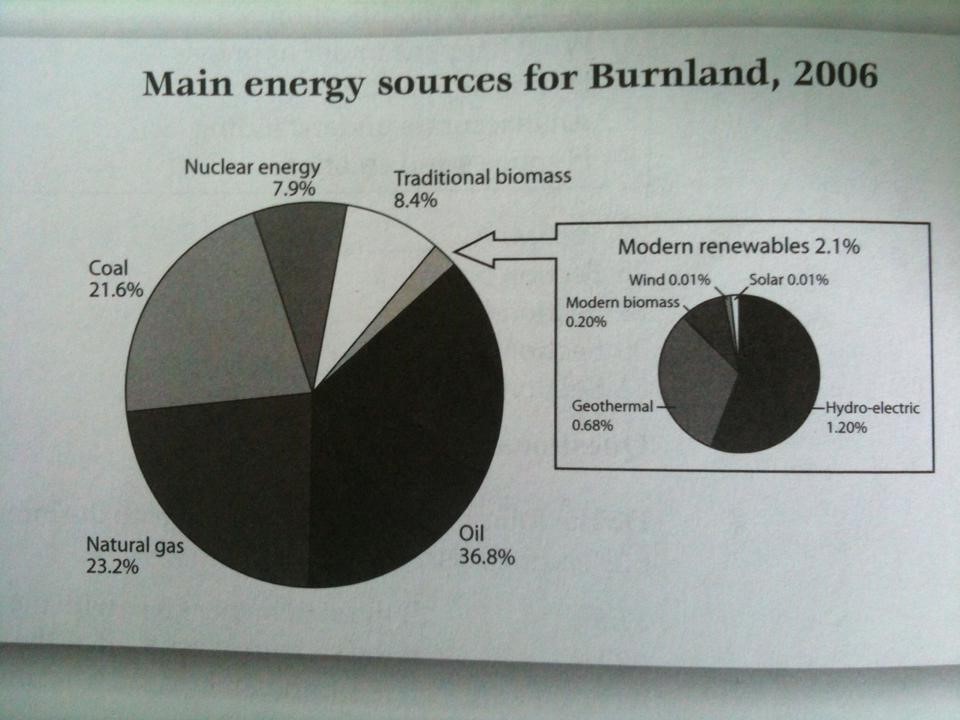
The chart below shows the proportions of one country's main energy supplies derived from different sources in 2006.
Summarize the information by selecting and reporting the main features and make comparisons where relevant.
The pie chart gives information about the percentages of Burnland's 2006 main energy provision originate in various sources. As can be seen from the figure, three types of fuel dominate in the country.
The most popular energy was oil that provided more energy sources than any other fuels by far - over a third (37 percent). In addition to oil, natural gas and coal were the next most popular energy. They were about two-fifths of the main energy sources and at just over 23 percent, natural gas is slightly larger than coal (about 21 percent).
The other special energy sources were nuclear power (about 8 percent) and two others: traditional biomass, with 7.8 percent; the least popular energy was modern renewables, which included wind power, solar power and modern biomass, all three of which were given by less than 0.5 percent. Finally, geothermal and hydro-electric were among modern renewable, with approximately 2 percent.
(152 words)

chart
