Unanswered [5] | Urgent [0]
  

Posts by bellajane [Suspended]
Name: Tran
Joined: Jan 17, 2017
Last Post: Jan 17, 2017
Threads: 1
Posts: 3  
Likes:
From: Viet Nam
School: secondary school

Displayed posts: 4
sort: Latest first   Oldest first  | 
bellajane   
Jan 17, 2017
Writing Feedback / The Line graphs of how much people in UK and US to spend on Petrol [8]

United StatesUnited Kingdom -> Need ' the' before these words.
different percentage -> different percentages . But with me , it isn't a good phrase
a gradual differences -> a gradual difference
two line -> two lines
I'm so sorry to say this essay has many grammatical mistakes. Just keep practicing and never give up. Good luck!
bellajane   
Jan 17, 2017
Writing Feedback / Given pie charts compare the number of inhabitants in Yemen and Italy in 2000 [5]

In my opinion, your introduction is not really good. 'Given are pie charts', you should use the phrase ' the given pie charts compare ...'. Both of THE countries is more correct.

In the second paragraph, saw a slight change ( with no 's')
Other mistakes were corrected by other people.
ah, one more thing to say: Cohesion in your essay is quite good. Keep up your work! Just practice!
bellajane   
Jan 17, 2017
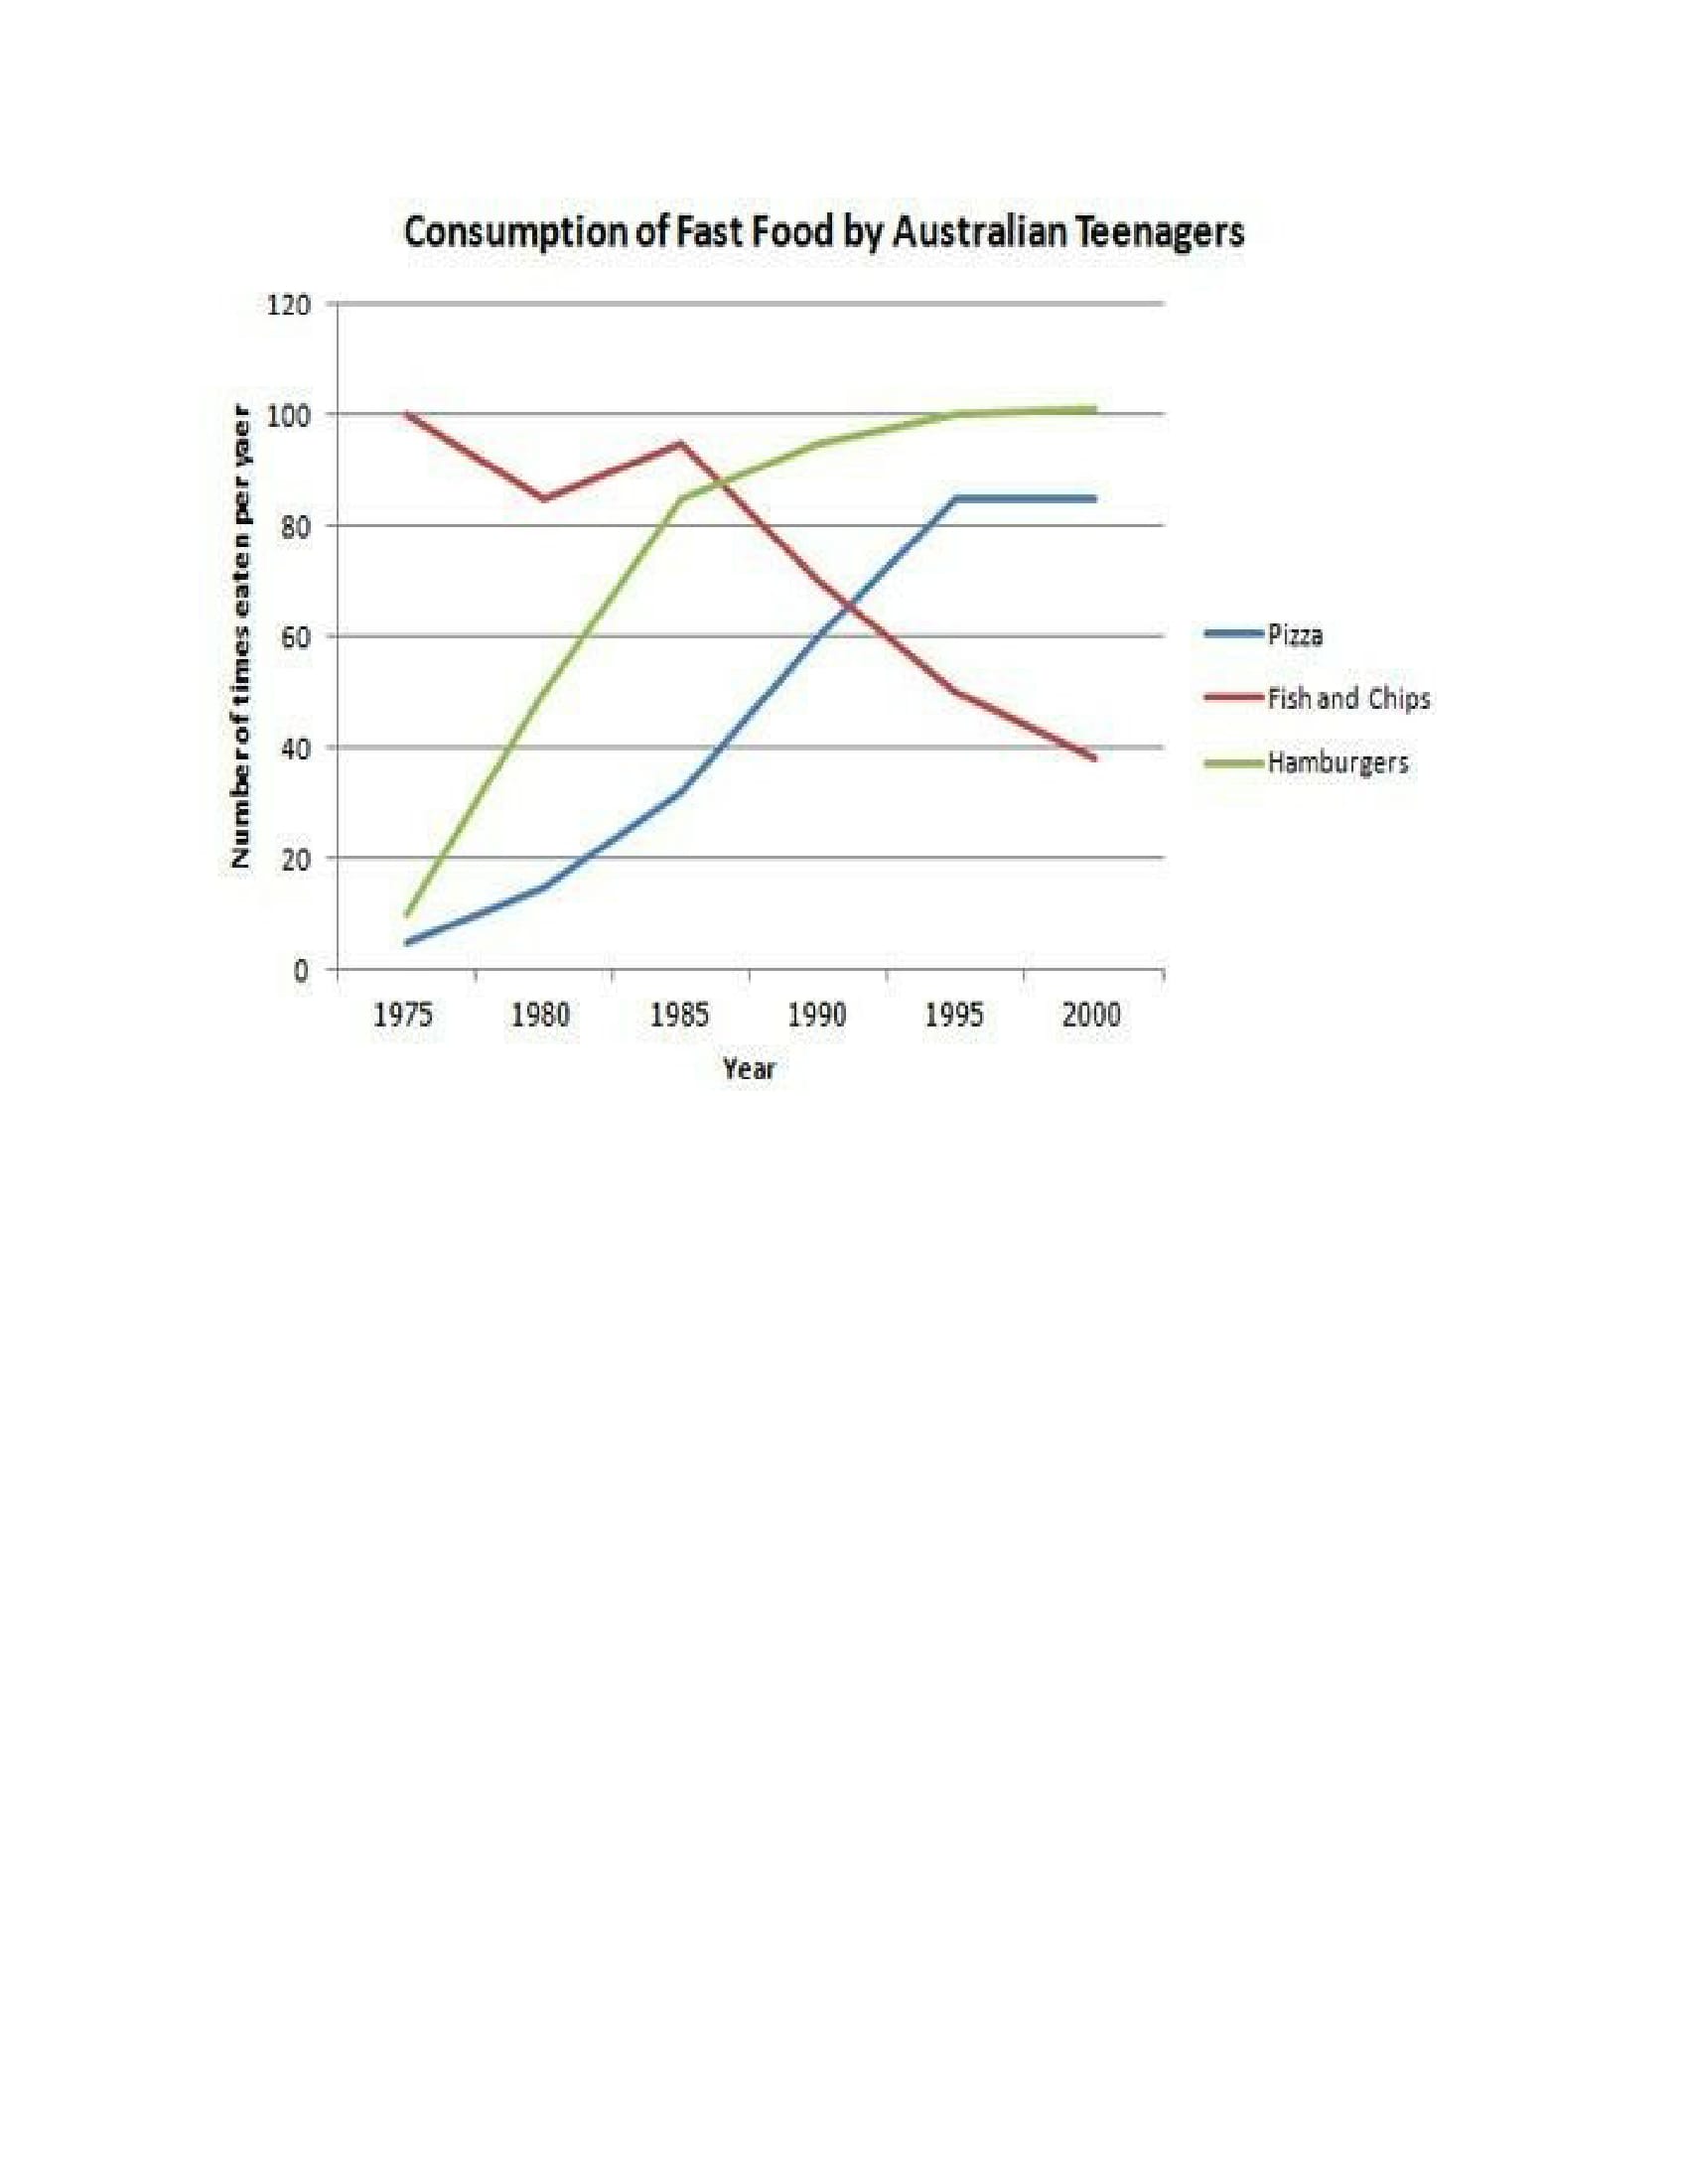
Writing Feedback / The number of times that youngsters ate 3 kinds of junk food namely pizza, hamburgers, fish & chips [4]

counting junk foods being eaten


The given line chart compares the number of times that youngster ate 3 kinds of junk food namely pizza, hamburgers, fish and chips in Australia during the period of 1975 and 2000.

Overall, there was an upward trend in pizzas and burgers, while chips and fish had a downward tendency. It is clear from the graph that with the highest point of the total became the lowest point at the end of the period.

In 1975, pizzas and burgers were the lowest consumption, at just over 5 times eaten per year and around 10 times, respectively. Meanwhile, fish and chips are the most popular fast food, which were exactly 100 times consumed by Australian teenagers per year, followed by a small degree of fluctuation up to the year of 1985. The pizzas' intake climbed modestly to about 40 times in 1985. In the meantime, the burgers' eating experienced the same upward trend as pizzas' but rose significantly to nearly 90 times.

From 1985 to 1995, fish and chips saw a sharp decline and hit its bottom at approximately 40 times. At the same time, there were a steady increase in pizzas' and burgers' consumption and remained quite stable until 2000.
Do You Need
Academic Writing
or Editing Help?
Fill in one of the forms below to get professional help with your assignments:

Graduate Writing / Editing:
GraduateWriter form ◳

Best Essay Service:
CustomPapers form ◳

Excellence in Editing:
Rose Editing ◳

AI-Paper Rewriting:
Robot Rewrite ◳