teephan226
Apr 25, 2017
Writing Feedback / Line chart - IELTS task 1 - the rate of recycled plastics, glass, paper and aluminium [2]
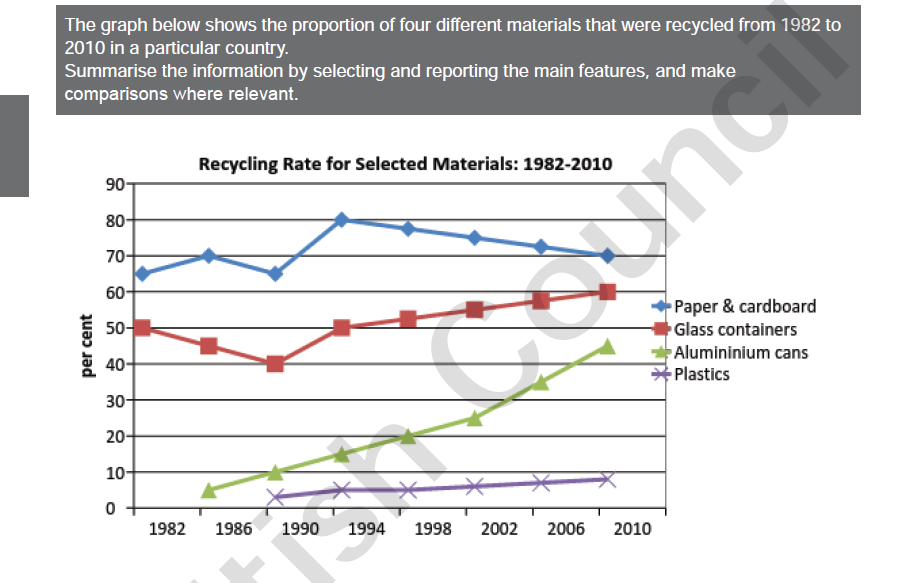
The line chart illustrates the recycling rate of four different materials from starting point in 1982 to 2010 in a nation.
Overall, it is clear that there were upward trends in the proportion of four materials in the period surveys.
In 1982, the percentage of glass containers reused started at 50%, while the figure for paper and cardboard recycled was 65%. In 1990, after fluctuating, the rate of paper and cardboard still stood at 65%, by contrast, the proportion of reused glass containers steadily fell to 40%. in the period from 1990 to 2010, after reaching a peak at 80% in 1994, the rate of recycled paper and cardboard gradually dropped to 70% in 2010, whereas the number for glass containers significantly increased to 50% after a decade.
In 1986, this was starting point period that aluminium cans which were recycle in that county, the percentage of this reused material was below 10% and this figure rocketed to more than 40% in 24 years. In 1990, the rate of recycled plastics was 3% and after tow decades, this number slowly climbed to approximately 10% in 2010.
Thank you and help me to review my report, please give me score!!!

7.png
