hoangmyvo
Jul 12, 2017
Writing Feedback / The graph gives information about drinking habits in the US by age. [2]
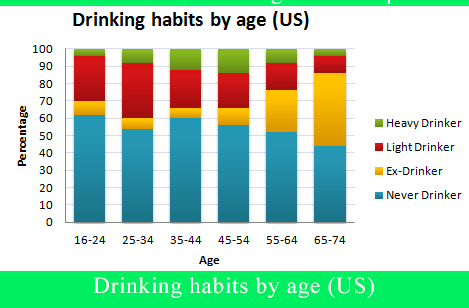
The bar chart above presents the information about people's drinking behavior by age group in the US.
Accordingly, the highest proportion of those who never drink falls into 16-24 years group. However, this number tended to decrease with age. Only 45% of people who turned to age 74 had never drunk.
On the other hand, the percentage of those who had quitted drinking tended to increase with age. Only 5% of the youngest age group were ex-drinker, compared with 40% of the oldest age group.
People in the age of 25 to 34 had the most number of light drinkers, accounting for 30% of the total. The middle age group (45-54) was supposed to be the heaviest drinkers, amounting to 14%. A relatively small proportion of those in the youngest age group and even smaller number in the oldest age group (roughly 3%) drink heavily.
alcohol use in the usa
The bar chart above presents the information about people's drinking behavior by age group in the US.
Accordingly, the highest proportion of those who never drink falls into 16-24 years group. However, this number tended to decrease with age. Only 45% of people who turned to age 74 had never drunk.
On the other hand, the percentage of those who had quitted drinking tended to increase with age. Only 5% of the youngest age group were ex-drinker, compared with 40% of the oldest age group.
People in the age of 25 to 34 had the most number of light drinkers, accounting for 30% of the total. The middle age group (45-54) was supposed to be the heaviest drinkers, amounting to 14%. A relatively small proportion of those in the youngest age group and even smaller number in the oldest age group (roughly 3%) drink heavily.

barchart1.png

