Writing Feedback /
IELTS task 1-The charts below give information on the ages of people when they got married... [4]
proportion of getting married people by different age groups
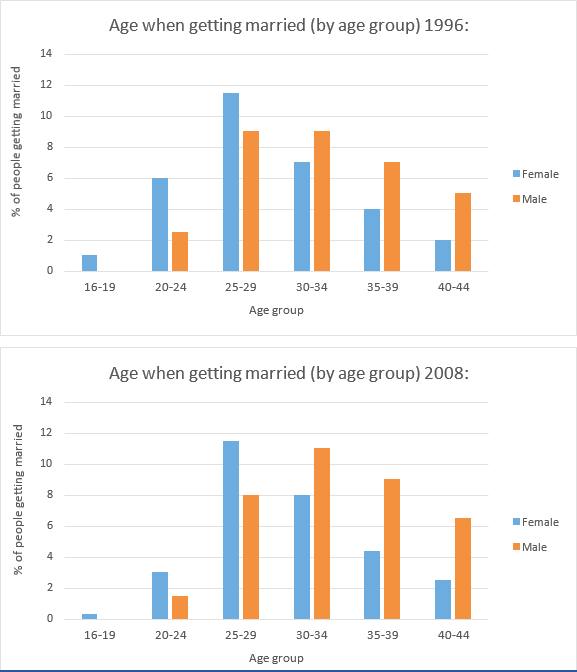
The bar charts show data about six age groups of men and women who got married in an unknown country in 1996 and 2008
Overall, the proportion of younger age groups that got married decreased, while older age groups increased. Moreover, the percentage of male and female aged 16-19 occupied the lowest quantity of marriage.
Looking at the charts in more detail, it is worth noting that there was a significant drop in the percentage of female aged 20-24, from 6% to only 3%. In contrast, the proportion of married women aged 30-34, 35-39 and 30-44 had grown from 7% to 8%, 4% to around 4.2% and 2% to about 2.2%, respectively. Meanwhile, the percentage of female aged 25-29 that got married remained no change, at almost 12%.
Also noteworthy is that there was a slight decline in the percentage of married men aged 20-24 and 25-29, from around 2.2% to under 2% and 9% to only 8%, respectively. On the other hand, the proportion of male who married in the age between 30-34, 35-39 and 40-44 had risen noticeably, from 9% to 11%, 7% to 9% and 5% to almost 7%, respectively.

BarCharts.png

