emilyyellowleade
May 29, 2018
Writing Feedback / IELTS1 - pie chart marking the retail sections of the online sales in Canada during 2005 and 2010 [3]
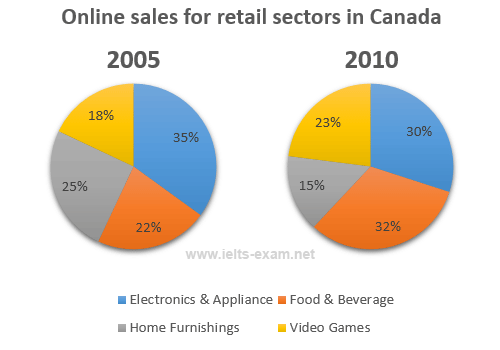
The two pie charts compare the retail sections of the online sales in Canada during 2005 and 2010
Generally, it is obvious that electronic and appliance dominated most of the online sale in 2005, while majority of the online sales in 2010 was food and beverage. In contrast, video games had the least influence in 2005, but the smallest proportion of online sales was replaced to home furnishings in 2010.
It is clear that the figure of food and beverages increased significantly to 10% more in 2010 and became the highest online sales. At the same time, the video games sales rose slightly from 18% to 23% over a 5 years period.
At the beginning, home furnishings was the second highest online sales, made up of a quarter of the charts. But it decreased dramatically to 15% after 5years. While the electronic and appliance accounted for 35% of the online sales for retail sectors in 2005, it experienced a declination to less than a third in 2010.
the sale records over the internet
The two pie charts compare the retail sections of the online sales in Canada during 2005 and 2010
Generally, it is obvious that electronic and appliance dominated most of the online sale in 2005, while majority of the online sales in 2010 was food and beverage. In contrast, video games had the least influence in 2005, but the smallest proportion of online sales was replaced to home furnishings in 2010.
It is clear that the figure of food and beverages increased significantly to 10% more in 2010 and became the highest online sales. At the same time, the video games sales rose slightly from 18% to 23% over a 5 years period.
At the beginning, home furnishings was the second highest online sales, made up of a quarter of the charts. But it decreased dramatically to 15% after 5years. While the electronic and appliance accounted for 35% of the online sales for retail sectors in 2005, it experienced a declination to less than a third in 2010.

Tast 1 pie chart
