bovalenca
Aug 24, 2018
Writing Feedback / Writing task 1 in IELTS (the employment patterns in the USA between 1930 and 2010) [5]
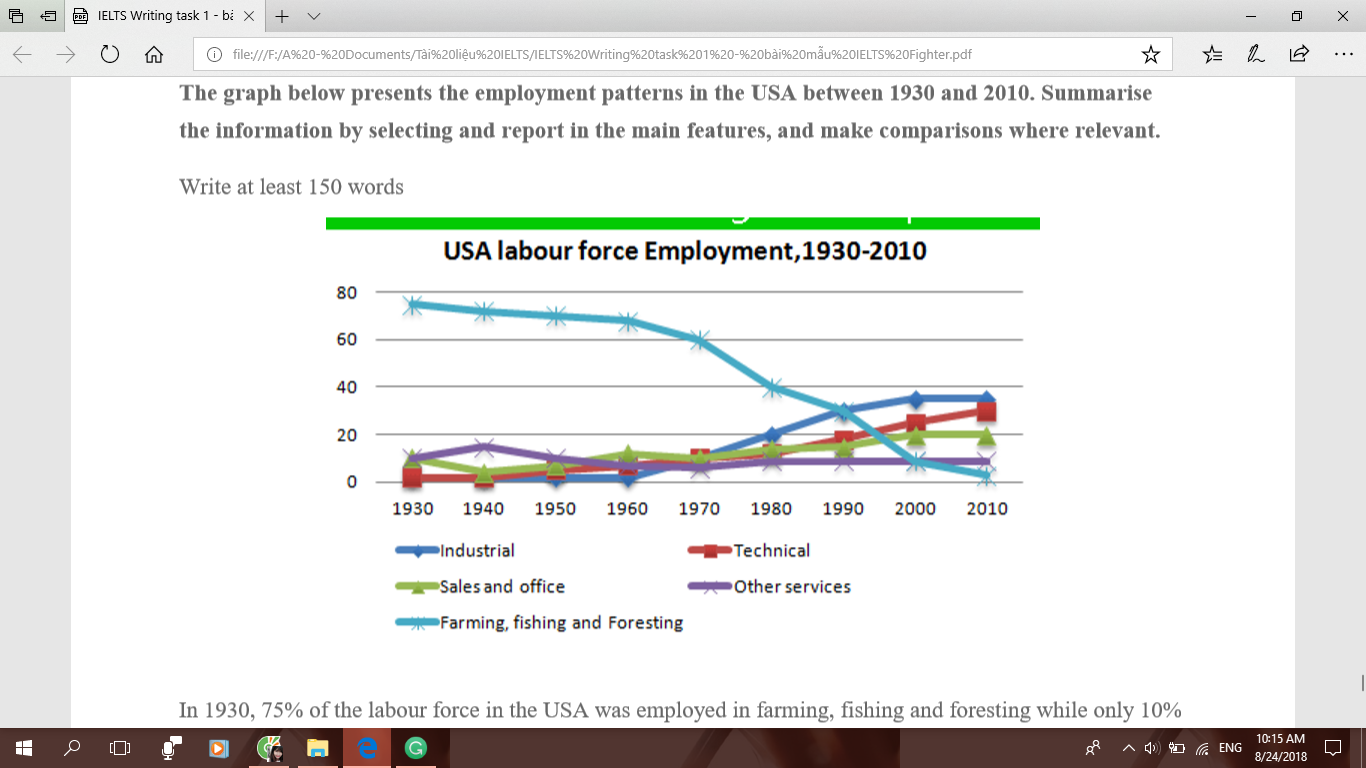
The line graph depicts information about the employment patterns in the USA over a period of 80 years.
It's noticeable that the figures for labour force employment almost increased after 1980 except the farming, fishing and foresting fall dramatically and saw a small decreased came from other services.
In 1930, the two sectors include sales and office and other services started at 10%. Almost no one had worked in technical, while around 75% labour force employment had come from farming, fishing and foresting.
Employment from industrial, technical, other services, sales and office was quite stable between 1930 to 1970. At the same time, Farming, fishing and foresting fall gradually by 15% to 60% in 1970.
After 1980, The number of employees from industrial, technical, sales and office saw a rise was 35%, 30% and 20% respectively. Didn't have a change from other services, it keeps constant the same level over a period of 20 years at 10%. There was a quick drop in the number of the worker from farming, fishing and foresting, nearly 8% in 2010.
The number of employees in USA 1930-2010
The line graph depicts information about the employment patterns in the USA over a period of 80 years.
It's noticeable that the figures for labour force employment almost increased after 1980 except the farming, fishing and foresting fall dramatically and saw a small decreased came from other services.
In 1930, the two sectors include sales and office and other services started at 10%. Almost no one had worked in technical, while around 75% labour force employment had come from farming, fishing and foresting.
Employment from industrial, technical, other services, sales and office was quite stable between 1930 to 1970. At the same time, Farming, fishing and foresting fall gradually by 15% to 60% in 1970.
After 1980, The number of employees from industrial, technical, sales and office saw a rise was 35%, 30% and 20% respectively. Didn't have a change from other services, it keeps constant the same level over a period of 20 years at 10%. There was a quick drop in the number of the worker from farming, fishing and foresting, nearly 8% in 2010.

40017128_22928632108.png
