Writing Feedback /
Air pollution and emission - Writing- Ielts- task 1- line graph [4]
Hi everyone! I'm a new member. I'm practicing for ielts but my english is not really good. If you are not busy, please help me find out some mistakes that I have made, thanks for all.
uk air pollutants between 1990 and 2005
My writing:
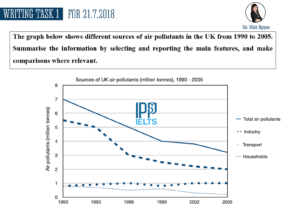
The diagram gives information on three sources which cause the air pollution in the United Kingdom between 1990 and 2005.
It is clear from the graph that there was a downward trend in the total air pollutant in the UK in 15-year-period. Besides, the amount of emission from industry is bigger than that of household and transport through the period shown .
In 1990, there was 7 million tons of air pollutant which are produced in this country. Industry became the main source with about 5.5 tons. The figure for emission from the household and transportation are the same with about 0.9 tons. From 1990 to 1996, while the amount of air pollutant from transport was unchanged and from households decrease slightly, that of industry went into free fall to 3 tons. As a result, the total air pollutant rocket by 2 tons.
From 1996 to 2005, air pollutant from industry and households continued decline while that of transport increase slightly. In 2005, households hardly produced air pollutant. Industry accounted for 2 million tons of air pollutant, doubled the figure for transport.

ieltswritingtask1.png

