Writing Feedback /
IELTS TASK 1 Line Graph - number of consumers who spent money on a books in some European Countries [3]
printed books purchased
There is a line graph at the end of the message,
and here is my text:
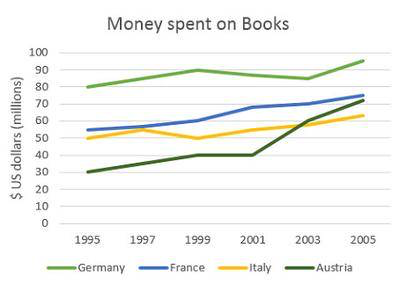
The line graph indicates how much money was spent on books in four European Countries which are Germany, France, Italy and Austria respectively over a period of ten years between 1995 and 2005.
As can be seen in the graph, Germany spent the biggest amount of money in 1995, while Austria spent the least amount. In more detail, Germany continued its upward trend to 90 million US dollars until 1999, then dropped slightly by 2003, but soon hit the new high at around 95 million dollars in the end of the year 2005. Although people in Austria spent the least amount of money among the four countries in 1995, they paid more and more money in the following ten years and took over Italy in 2003 with the figure of 62 million us dollars to rank in the third place.
France and Italy showed similar proportion to each other with fairly constant trend since 1995, and the both countries reached the peak with the amount of 75 and 63 million US dollars by 2005.
Thank you in advance to help improving my writing skills❤️

54D7766B5F3D4DAAA.png

