Rhiza
Aug 18, 2019
Writing Feedback / Pie charts - Result of surveys of visitor satisfaction-IELTS Writing task 1 [3]
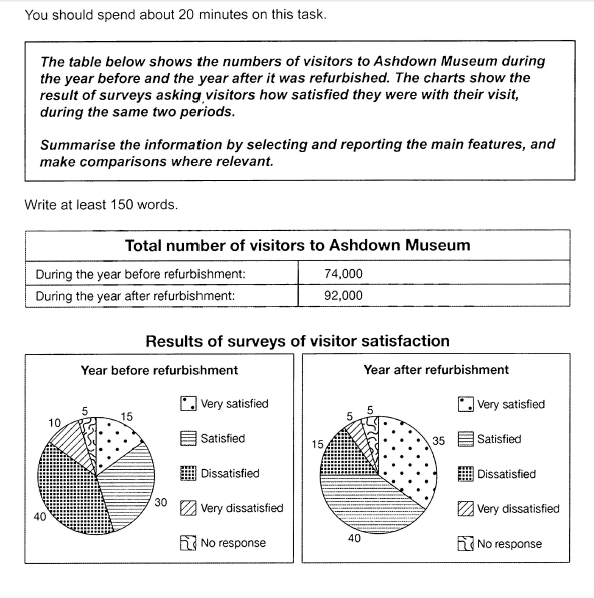
Writing Task 1: The table below shows the numbers of visitors to Ashdown Museum during the year before and the year after it was refurbished. The charts show the result of surveys asking visitors how satisfied the were with their visit, during two periods.
The pie charts compare the number of people who feel satisfied toward Ashdown Museum before and after the refurbishment as well as the comparison how much people visit the museum.
Overall, there was an improvement in the number of people who felt satisfied with the museum after the establishment. It was shown by a remarkable increase in the fraction of satisfied visitors and a decline in unsatisfied visitors.
Before the refurbishment, the survey accounted for 40% dissatisfied people of the total visitors. Meanwhile only fifteen percent felt satisfied with the museum. The proportion therefore declined from the highest fraction (40%) to a smaller percentage (15%).
In contrast, the museum experienced a sudden growth of visitors after the refurbishment. Initially, the proportion of people is around 15% of very satisfied visitors and it increased to reach more than a third of the total. The visitors were measured 92000 while it was only around 72000 before the refurbishment, a drop of 20 thousand people.
comment on tourists enjoyment - Ashdown Museum
Writing Task 1: The table below shows the numbers of visitors to Ashdown Museum during the year before and the year after it was refurbished. The charts show the result of surveys asking visitors how satisfied the were with their visit, during two periods.
The pie charts compare the number of people who feel satisfied toward Ashdown Museum before and after the refurbishment as well as the comparison how much people visit the museum.
Overall, there was an improvement in the number of people who felt satisfied with the museum after the establishment. It was shown by a remarkable increase in the fraction of satisfied visitors and a decline in unsatisfied visitors.
Before the refurbishment, the survey accounted for 40% dissatisfied people of the total visitors. Meanwhile only fifteen percent felt satisfied with the museum. The proportion therefore declined from the highest fraction (40%) to a smaller percentage (15%).
In contrast, the museum experienced a sudden growth of visitors after the refurbishment. Initially, the proportion of people is around 15% of very satisfied visitors and it increased to reach more than a third of the total. The visitors were measured 92000 while it was only around 72000 before the refurbishment, a drop of 20 thousand people.

Annotation2019081.png
