An Huynh
Nov 20, 2019
Writing Feedback / The graph - consumption of fish and meat in an European country - how much grams per week? [4]
Please read and give me some feedback about this paragraph-task 1 in IELTS. Thank you so much for your comments.
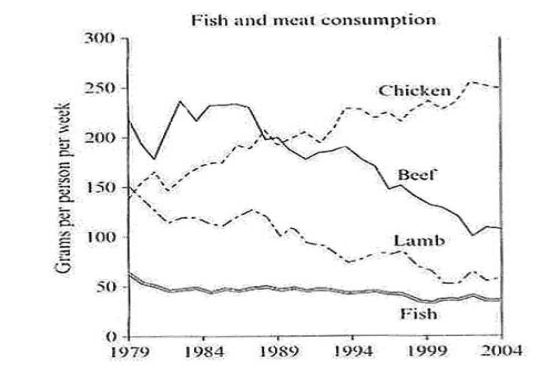
The given line graph illustrates the spending fish and three various types of meat in a country in Europe over a 25-year period.
Overall, it is noticeable that there was a downward trend in the figures for most consumption of food, excepting chicken expenditure. The fish consumption was lowest throughout the period shown.
It can be seen from the graph that in 1979, the amount of beef was consumed peaked at about 220 grams per person per week. The figure for lamb and chicken were lower, which stood at 150 grams and under 150 grams respectively. By contrast, the consumption of fish was low around 60 grams in this year.
By 2004, country witnessed a decline sharply about the expenditure of beef, which about 250 grams, which reached a peak at 250 grams in 1983. In the year 2004, about 50 grams of fish was eaten, compared to 40 grams. By contrast, there was a significant growth about the consumption of chicken about 250 grams in the final year.
Please read and give me some feedback about this paragraph-task 1 in IELTS. Thank you so much for your comments.
trends of food consumption
The given line graph illustrates the spending fish and three various types of meat in a country in Europe over a 25-year period.
Overall, it is noticeable that there was a downward trend in the figures for most consumption of food, excepting chicken expenditure. The fish consumption was lowest throughout the period shown.
It can be seen from the graph that in 1979, the amount of beef was consumed peaked at about 220 grams per person per week. The figure for lamb and chicken were lower, which stood at 150 grams and under 150 grams respectively. By contrast, the consumption of fish was low around 60 grams in this year.
By 2004, country witnessed a decline sharply about the expenditure of beef, which about 250 grams, which reached a peak at 250 grams in 1983. In the year 2004, about 50 grams of fish was eaten, compared to 40 grams. By contrast, there was a significant growth about the consumption of chicken about 250 grams in the final year.

Capture.PNG
