tienphat
Dec 20, 2019
Writing Feedback / Writing IELTS Task 1: Line graph about the movement to urban area in 3 countries [4]
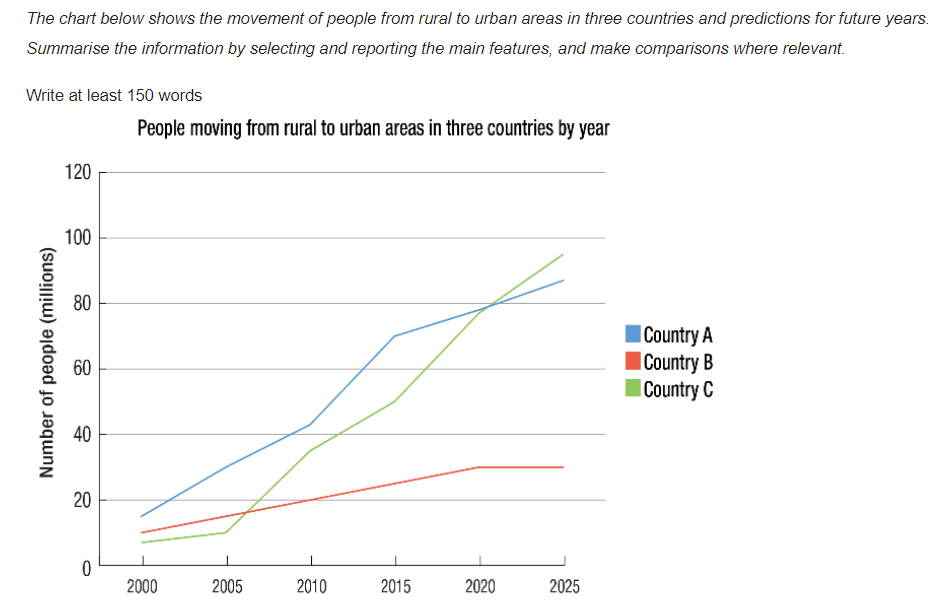
The line graph represents the proportion of three countries' citizens who has moved from countryside to the metropolitan from 2000 up to now and how this number will be changed 5 years later.
Overall, all three countries have been witnessing the increases in the number of people's movement in the whole period but the proportion has experienced a more significant alteration in country A and C.
First of all, in 2000, the number of people deciding to move in three countries could not reach 20 million. However, in the next 5 years, the number of urbanites in country A started rising sharply and there was a gradual change in the country B's. On the other hand, the migration in country C did not progress at a high speed as it had only soared 1 to 2 million by 2005.
Nevertheless, from 2005 to 2020, the number of settlers in country C has skyrocketed markedly and has chased after the movement of country A until both countries reached 80 million in 2020 simultaneously. In a foreseen future, the number of people shifting to capital city in country C is predicted to surge over the country A's proportion. In contrast, after increasing gradually until 2020, the tendency in the number of urbanites in country B is anticipated keeping stable in the next 5 years.
people moving from rural to urban places
The line graph represents the proportion of three countries' citizens who has moved from countryside to the metropolitan from 2000 up to now and how this number will be changed 5 years later.
Overall, all three countries have been witnessing the increases in the number of people's movement in the whole period but the proportion has experienced a more significant alteration in country A and C.
First of all, in 2000, the number of people deciding to move in three countries could not reach 20 million. However, in the next 5 years, the number of urbanites in country A started rising sharply and there was a gradual change in the country B's. On the other hand, the migration in country C did not progress at a high speed as it had only soared 1 to 2 million by 2005.
Nevertheless, from 2005 to 2020, the number of settlers in country C has skyrocketed markedly and has chased after the movement of country A until both countries reached 80 million in 2020 simultaneously. In a foreseen future, the number of people shifting to capital city in country C is predicted to surge over the country A's proportion. In contrast, after increasing gradually until 2020, the tendency in the number of urbanites in country B is anticipated keeping stable in the next 5 years.

Topic
