Writing Feedback /
Women who worked in parliament - IELTS _Writing Task 1_Line Chart [8]
Female members of parliament
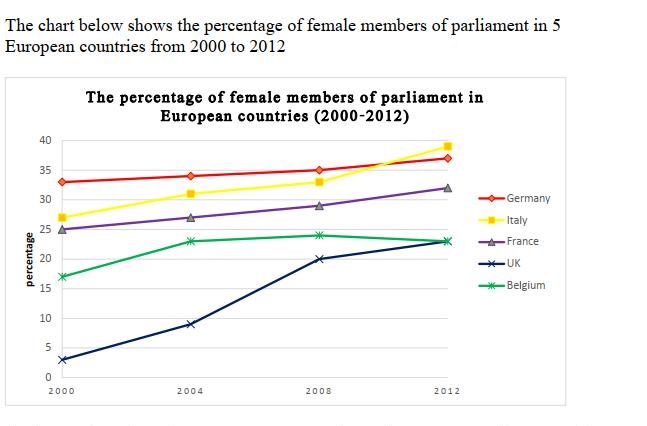
The line graph illustrates the proportion of women who worked in parliament in 5 different countries over a 12 year-period.
Overall, it is clear that the figure for ladies of UK in most years was lowest. However, the throughout the period shown, the percentage of female members increased in all 5 nations.
In 2000, over 33% women of Germany worked in congress that was highest. The Women figures for France and UK and were similar in 2000, around 25%, respectively, whereas the figure for Belgium was lower than 3 countries , about 20%. Although the strongest increase, the percentage of women in parliament in the UK were still lowest from under 5% in 200 to 20% in 2008.
Between 2008 and 2012, Italy's rate grew more than Germany and reached the highest point about 40% in 2012. Female members in Belgium decreased slowly and equaled the UK in 2012, around 22%. In France, the proportion of women saw a gradual rise during the 12 years, reaching a final figure of just over 30% in 2012.

ae57eaa31a76e128b867.jpg

