Posts by Sally 205 [Suspended]
Name: Nguyen Thu Huong
Joined: Apr 24, 2020 |
Last Post: Jun 15, 2020
Threads: 1
Posts: 2
|
From: Viet Nam
School: Thanh Mien high school
|
Displayed posts: 3
Writing Feedback /
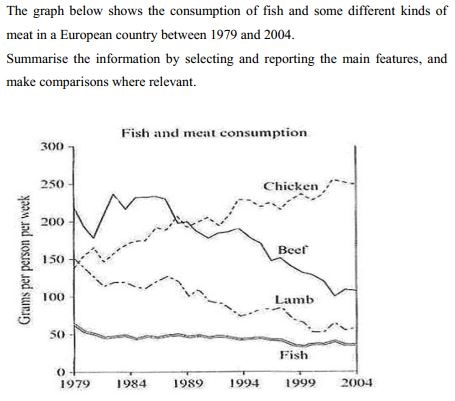
The graph illustrates the fish, lamb, beef and chicken consumptions in an European country [3]
Cambridge English IELTS 7. Test 2. Task 1.
The graph illustrates the fish, lamb, beef and chicken consumptions in an European country from 1979 to 2004.
There were a significant rise in the amount of chicken consumed and a steep decrease in beef and lamb consumptions. Meanwhile, the consumption of fish was stable during that time.
In 1979, beef was the most popular meat in this country. Between 1980 and 1986, the amount of beef consumed moderately fluctuated then rapidly declined: 220 grams and 100 grams per person per week respectively: 120 grams gone down.
At the beginning of the period, the chicken and lamp consumptions were quite the same : approximately 150 grams per person per week but these two features come to two different ways. The chicken consumption sharply went up to 250 grams for a person in a week: 100 grams per person per week rise. By comparison, the amount of lamb eaten remarkably dropped by a similar amount.
The amount of fish consumed had a slight unsteadiness with an inconsiderable slump over the 25 - year - period.
401.728.0_rdkm2vb8hx.jpg
ⓘ Need academic writing help? 100% custom and human!

