anthonyphan
May 3, 2020
Writing Feedback / IELTS PIE CHART: The charts illustrate the annual income and expense of a US charity organization. [4]
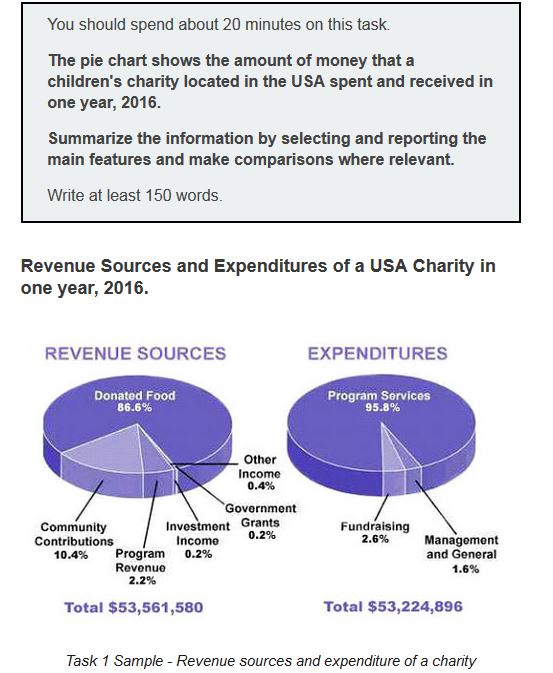
The charts illustrate the annual income and expense of a US charity organization in 2016.
Overall, the entity spent less money than they accumulated. The primary source of revenue was donated food and program service, and the majority of expenditures came from program service.
In regard to the revenue sources, donated food and community contributions accounted for exactly 97% of the money this entity accumulated ( donated food comprised of 86.6% and community contributions represented 10.4%). The remaining sources of revenue was program revenue (2.2%), investment income (0.2%), government grant (0.2%) and other income (0.4%). And the total revenue for the year was 53,561,580$.
In terms of expenditures, program service took the most significant part of total expenses the entity spent in 2016, which comprised of 95.8%. Beside that, the organization paid for fundraising activities (2.6%) and management and general (1.6%). And the total expenditure for the year was 53,224,896$
Revenue sources and expenditures of a USA charity
The charts illustrate the annual income and expense of a US charity organization in 2016.
Overall, the entity spent less money than they accumulated. The primary source of revenue was donated food and program service, and the majority of expenditures came from program service.
In regard to the revenue sources, donated food and community contributions accounted for exactly 97% of the money this entity accumulated ( donated food comprised of 86.6% and community contributions represented 10.4%). The remaining sources of revenue was program revenue (2.2%), investment income (0.2%), government grant (0.2%) and other income (0.4%). And the total revenue for the year was 53,561,580$.
In terms of expenditures, program service took the most significant part of total expenses the entity spent in 2016, which comprised of 95.8%. Beside that, the organization paid for fundraising activities (2.6%) and management and general (1.6%). And the total expenditure for the year was 53,224,896$

Piecharts2.JPG

