Writing Feedback /
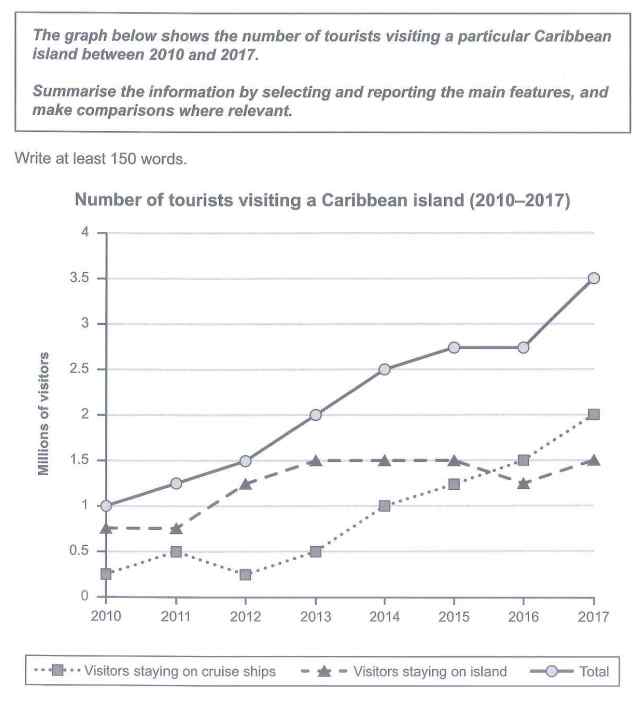
The graph below shows the number of tourists visiting a particular Caribbean island [3]
Please help!! It's my task 1:
number of visitors in some caribbean island
The graph demonstrates the quantiity of visitors to a particular Caribbean island between 2012 and 2017 in three different lines: Visitors dtaying on cruise ships, on island and tthe total. Overall, there were many changes throughout the period.
The most striking point is that, despite many differences in visitors' choice of living places among the period, the total of them gradually increased and reached its peak of 3.5 millions in the end. At first, the number of visitors staying on iland was 0.75 millions, which was 0.5 millions higher than that of visitors staying on cruise ships. Additionally, after two years, it had risen to 1.5 millions, contributed ¾ to the total. Hence, it remained the same for three years and lost the higher position to the other category. Quantity of visitors staying on cruise ships, in contrast, had an unstable proccess in the first three years. After that, it had risen dramatically and took the bigger contribution of 2 millions in 2017
Briefly, although the number of visitors staying on island had always being the higher for the fisrt five years, the other category had had an noticeable rise in the last two years, taking the bigger contribution

image14compressed..jpg

