Writing Feedback /
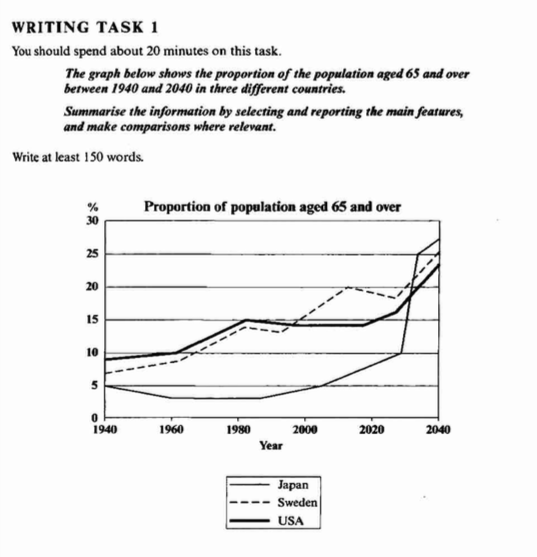
IELTS 1 task, The graph below shows the share of elderly population by country [3]
the population aged 65 and more
A glance at the line chart provide highlights the demographic numbers of people whose aged 65 and over in three different countries from 1940 to 2040.
Overall, there was a significant growing trendancy among all three countries. Noticeable, the percentage number of the people in USA was the highest at the beginning and lowest in the end. In contrast, Japan owns the lowest percentages at first but is predicted to be the highest in the future.
To probe more deeply, there was a gradual increase in population in the USA from 1940 to 1980; however, the percentage of population decreased slightly between 1980 and 2020. It is anticipated to grow up to 24% at 2040, which is three time as 1940. There was a fluctation between 1960 and 2030 in Swedwn, but it is estimated to climb to about 25% at 2040. Since the beginning of 1940,The trend of population in japan was slowly gone down. Nevertheless, it has consistantly risen since 1987 and it is anticipated to reach a peak at 27% to 2040.

202011.png

