thang1305
Feb 18, 2021
Writing Feedback / Ielts1 - The quantity of pineapple exports in three different countries and the cost of pineapple [2]
help me check this task 1 eassy very much
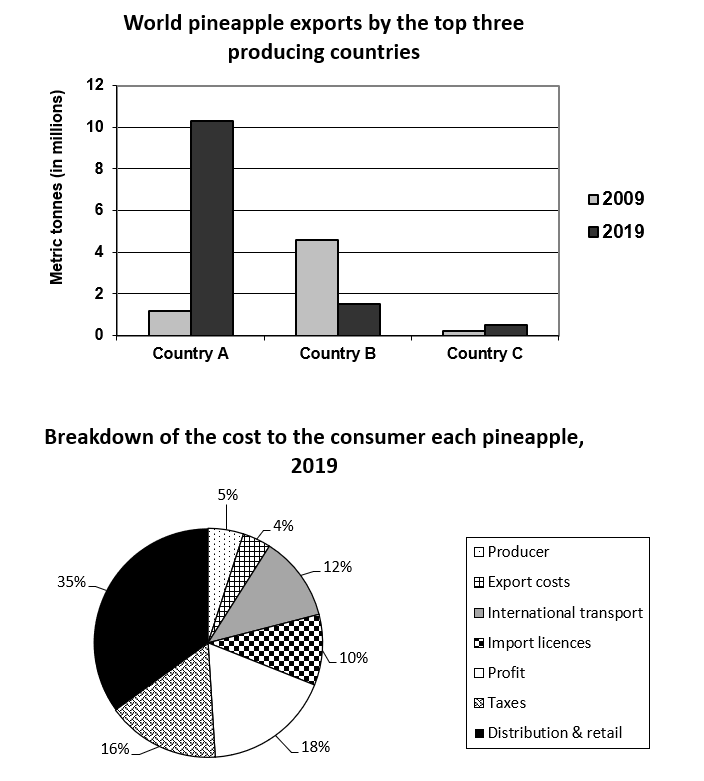
The bar chart shows the quantity of pineapple exports in three different countries in 2009 and 2019 while the pie chart compares declines in the cost of pineapple types in 2019 only.
Overview, the amount of fruit exports is different in each country and the greatest increasing one was of country A, opposing to a steady decrease of B one. Among seven factors, distribution and retail was the biggest one, followed by profit and taxes.
In detail, in 2009, the production of country A was over 1 metric million tonnes (MMT), being one-third of that of country B and much more than that in country C in the same year. In the next decade, country A increased sharply its quantity to over 10 times, being twice as many as it in country B whilst country C just rose slightly, reaching about 0.5 MMT in a similar period.
Turning to the pie chart, the proportions of breakdown reasons were significant. The largest one, 35%, belonged to distribution and retail factor while the second-highest percentage of taxes was only 18%, being a half compared to the first one. The two lowest proportions were of export costs and producer, being 4% and 5% respectively.
help me check this task 1 eassy very much
world pineapple exports
The bar chart shows the quantity of pineapple exports in three different countries in 2009 and 2019 while the pie chart compares declines in the cost of pineapple types in 2019 only.
Overview, the amount of fruit exports is different in each country and the greatest increasing one was of country A, opposing to a steady decrease of B one. Among seven factors, distribution and retail was the biggest one, followed by profit and taxes.
In detail, in 2009, the production of country A was over 1 metric million tonnes (MMT), being one-third of that of country B and much more than that in country C in the same year. In the next decade, country A increased sharply its quantity to over 10 times, being twice as many as it in country B whilst country C just rose slightly, reaching about 0.5 MMT in a similar period.
Turning to the pie chart, the proportions of breakdown reasons were significant. The largest one, 35%, belonged to distribution and retail factor while the second-highest percentage of taxes was only 18%, being a half compared to the first one. The two lowest proportions were of export costs and producer, being 4% and 5% respectively.

13fb3b74be9c4084a.png
