Writing Feedback /
Task 1- Consumer's on cell phone, national and international phones in America [3]
Spendings on phones in the usa
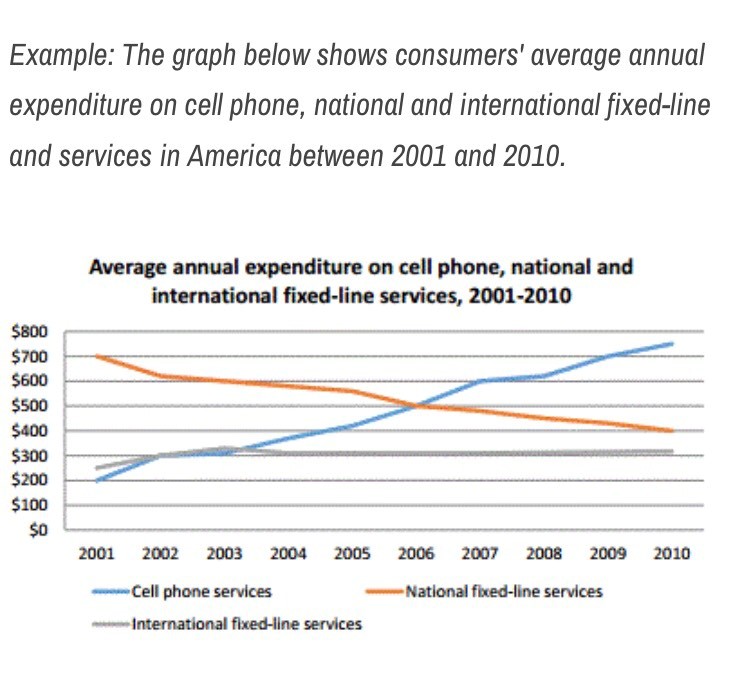
The line chart illustrates the average spending yearly of the American people for mobile phone, national and international landline phones in the period from 2001 to 2010.
Overall, it is clear that there was a significant increase of the spending on cell phones while national landline phones decrease gradually. It is also noticeable that the figure of international landline phones slightly rose and remained over the period shown.
According to the graph, in 2001, the national landline phone is the most popular communication service in America with average spending $700, compared only $250 and $200 on international landline phone and cell phone services respectively. Over the following 5 years, the annual expenditures of national services fell by around $250. By contrast, the level of yearly sending cell phone services rose by $350 during this same period and was same as the average figure of national phones in 2006, at about $500. Besides that, the average amount of overseas phones fluctuated slightly under $300 at the same time.
From 2006 to 2010, it can be seen that the average yearly expense for mobile phone services took over the national fixed-line phone service and became the most common means of communication. The amount of money of the US people spent on mobile phones grew about $150 per year. Whereas, the number of spending on national landline phones continued to decrease to just above $400 by 2010. As for the figure of international landline phones, the yearly spending was still remaining around $300.

