Unanswered [5] | Urgent [0]
  

Posts by lethiaixuan [Suspended]
Name: Lê Thị Ái Xuân
Joined: Jun 5, 2021
Last Post: Jun 8, 2021
Threads: 2
Posts: 4  
From: Viet Nam

Displayed posts: 6
sort: Latest first   Oldest first  | 
lethiaixuan   
Jun 7, 2021
Writing Feedback / The number of female and male teachers working in different forms of education setting in UK in 2010 [2]

report from the bar chart


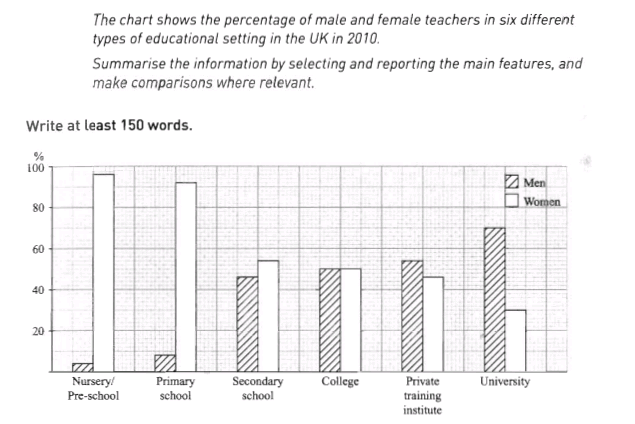
The bar chart compares the number of female and male teachers working in different forms of education setting in UK in 2010.
Overall, the fluctuation between the proportion of teachers being woman an men is obvious. While male teachers hold a major percentage in university, female ones have a particularly significant presence of teaching in nursery and primary school.

There is a big difference in gender gap. From over 90% to 95% of teachers being female and male do in nursery and under secondary school positions, whereas male teachers reach from 5 to 9 % of teachers teaching in this educational level. However, the percentage of male lecturers are two times as many as female with 60% representing in university teaching posts.

Regarding other 3 educational levels, the proportion of female and male teachers make up a slightly similarity at 50% of those in college. Both men and women hold at 45 to 55% in secondary school and private training institute.

Please score me that is motivation for me to try.


  • Capture.PNG
lethiaixuan   
Jun 5, 2021
Writing Feedback / The line chart illustrates the population growth in New Zealand between 1950 and 2050 [5]

New Zealand population analysis


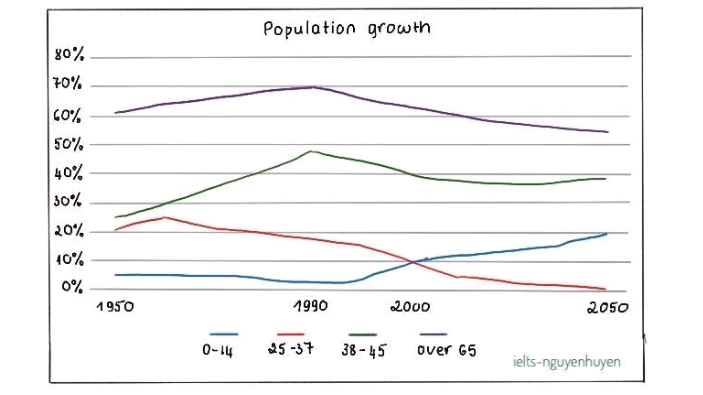
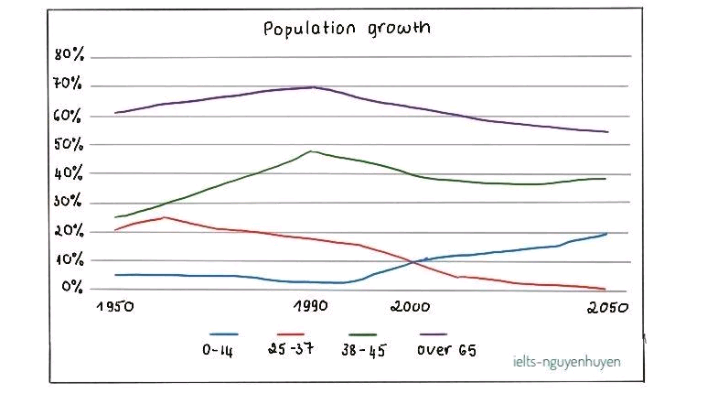
The line chart illustrates the population growth in New Zealand between 1950 and 2050.
Overall, the percentage of New Zealand population aged 65 and over dominated over the period show on the graph. While the age of 14 and under saw an increase, the people falling into the 24 to over 60 age group had fallen.

In the year 1950, over 60% of population of New Zealand was the people aged over 65. The respective figure for people between 25-37 and 38-45 was around just over 20% and 25%. The proportion of children falling Into the 0 to 14 age group made up the lowest percent was close to 5%. Over the following 40 years, the 38-45 age people reached its peak, to nearly 50% percent and with the older group rose by around 9%. However, the 25 to 37 age group was down by about 5% and the 14 and under fell steadily in the same period.

From 1990 to 2050, there was a dramatic increase in the people between 0 to 14 age, to nearly 17%. By contrast, the people falling into 38-45 age group dropped to almost 1%. The number of people old aged group had fallen by approximately 15% and 10% for 38 to 45 one.

Hope to receive your comments


  • Capture.PNG

  • Capture.PNG
Need Writing or Editing Help?
Fill out one of these forms:

Graduate Writing / Editing:
GraduateWriter form ◳

Best Essay Service:
CustomPapers form ◳

Excellence in Editing:
Rose Editing ◳

AI-Paper Rewriting:
Robot Rewrite ◳

Academic AI Writer:
Custom AI Writer ◳