Writing Feedback /
WRITING TASK 1- the proportion total expenditure in a certain European country between 1960 and 2000 [3]
expenditure proportion in different countries
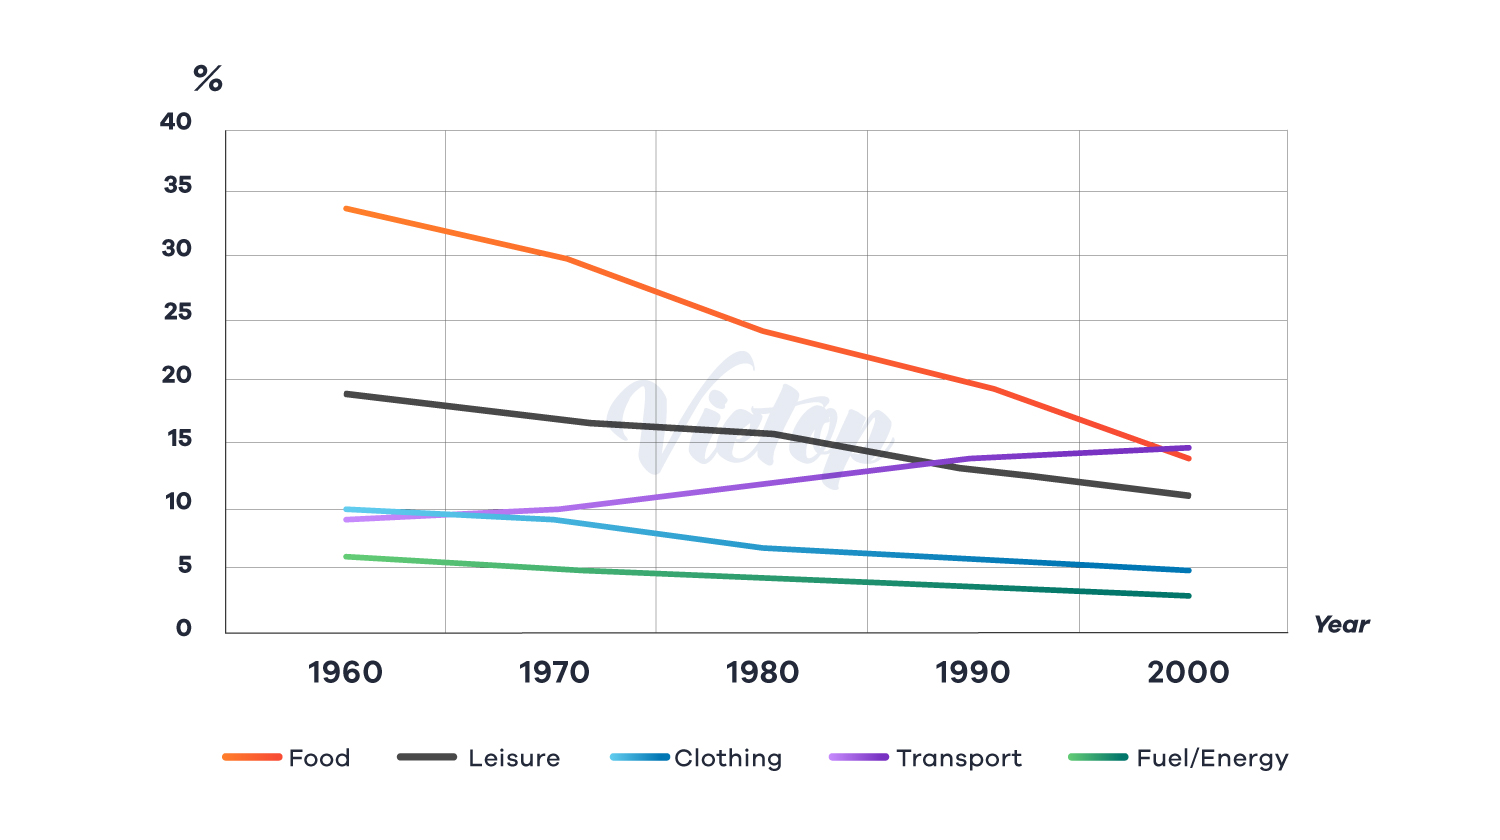
The chart compares the percentage of the total cost for 5 fields in a specific European country over a period of 40 years
Overall, the total expenditure on five sectors increased from 1960 to 2000. In particular, the amount of money for transport rose, while the proportion for food, leisure, clothing, and fuel/energy fell in the whole period of the country
In 1960, the proportion of expenditure on food was highest which accounted for approximately 35%. Around 18% of the money was spent on leisure, but only about 6% on fuel/energy. The figures for clothing and transport was nearly the same, at around one half of that amount of leisure
The biggest change was seen in the proportion of food, which fell steadily over the 40-year period to 15% in 2000. In contrast, the proportion of expenditure on transport rose, reaching nearly 15%, which make the sector be the highest in 2000. The cost for both clothing and fuel/energy decreased slightly, at about 5% and 3% perspectively. Similarly, there was also a drop in the figure for leisure by 10%

Picture2.png

