Orchid pham
Jun 24, 2021
Writing Feedback / IELTS WRITING TASK 1: The changes in ownership of electrical appliances [3]
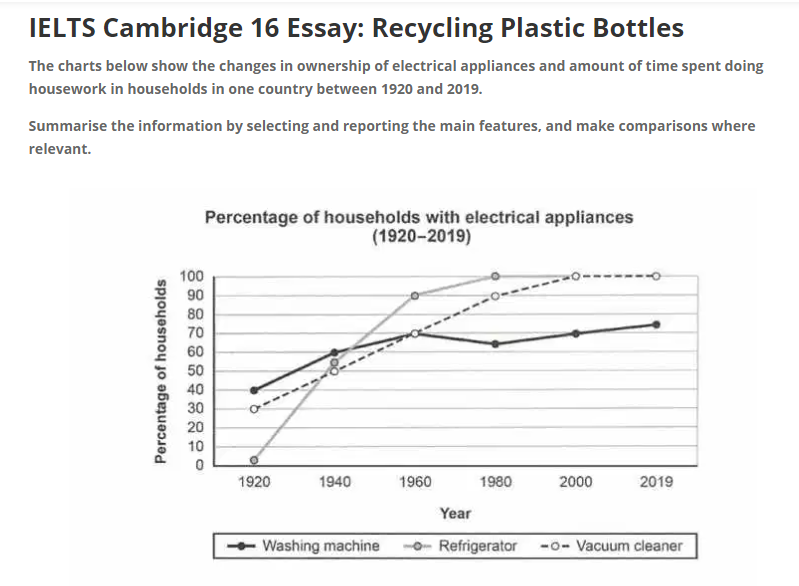
The first line graph illustrates the number of ownership of electrical appliances altered from 1920 to 2019, while the second graph depicts the amount of time spent doing chores every week over the same period.
Overall, it can be seen that the proportion of households with washing machine, refrigerator, and vacuum cleaner increased rapidly which mean they became more popular in modern society. By contrast, the total time spent on household per week plummeted.
In 1920, the percentage of refrigerators was lowest, just 0%. After 20 years, refrigerators observed a dramatic rise and they reached a plateau of 100% in 1980. At the beginning point, the figure for washing machines was ahead of vacuum cleaners by a wide margin, at 30% for the former and 40% for the latter. Both figures then increased significantly, however, the proportion of vacuum cleaner surpassed the other and hit the highest point of 100% in 2000. The data for the washing machine went up slightly to approximately 70% after witnessed a minimally decline while refrigerator and vacuum cleaner took the leading position many decades till the end of the period.
As can be seen from the second line graph, it is obvious that the number of hours of housework in 1920 was 50 hours. Furthermore, when society became more technological and modernized the citizens tent to depend on electronic devices, and maybe that was the reason why the amount of time spent on chores plummeted to 10 hours in 2019.
Please give me some feedbacks on my essay. I grateful thank you!!!
percentage of households with electrical appliances
The first line graph illustrates the number of ownership of electrical appliances altered from 1920 to 2019, while the second graph depicts the amount of time spent doing chores every week over the same period.
Overall, it can be seen that the proportion of households with washing machine, refrigerator, and vacuum cleaner increased rapidly which mean they became more popular in modern society. By contrast, the total time spent on household per week plummeted.
In 1920, the percentage of refrigerators was lowest, just 0%. After 20 years, refrigerators observed a dramatic rise and they reached a plateau of 100% in 1980. At the beginning point, the figure for washing machines was ahead of vacuum cleaners by a wide margin, at 30% for the former and 40% for the latter. Both figures then increased significantly, however, the proportion of vacuum cleaner surpassed the other and hit the highest point of 100% in 2000. The data for the washing machine went up slightly to approximately 70% after witnessed a minimally decline while refrigerator and vacuum cleaner took the leading position many decades till the end of the period.
As can be seen from the second line graph, it is obvious that the number of hours of housework in 1920 was 50 hours. Furthermore, when society became more technological and modernized the citizens tent to depend on electronic devices, and maybe that was the reason why the amount of time spent on chores plummeted to 10 hours in 2019.
Please give me some feedbacks on my essay. I grateful thank you!!!

cam16.PNG
