Junilina
Aug 6, 2021
Writing Feedback / Consumption of 6 different kinds of energy in USA [2]
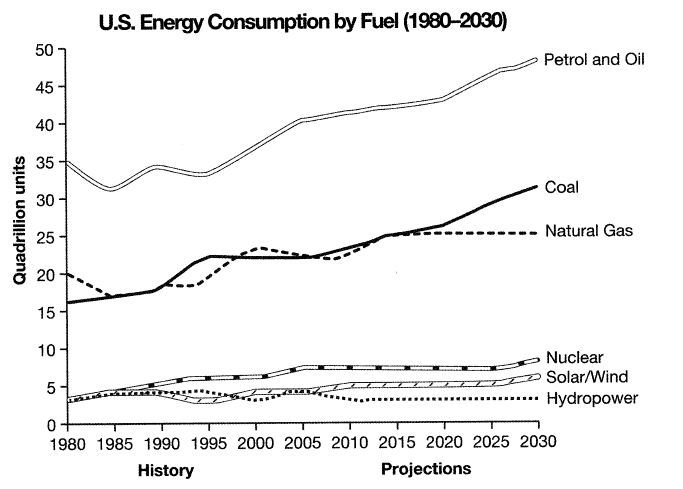
The line graph illustrates the data was released in a 2008 report about 6 different kinds of energy consumption in America since 1980 and the future forecast for 2030.
It can be seen that there were increase trends in most categories during the period of research. In addition, Petrol and Oil were used most during this period.
In 1980, the amount of Petrol and Oil consumed was 35 quadrillion units, nearly doubling that of Natural Gas, at 20 quadrillion units. The figure for Coal was slightly less at that time, just over 15 quadrillion units. In comparison, the consumption of natural energy was equal, standing at under 5 quadrillion units each. Each of energy was seen fluctuations during in the following years.
The charts also give the projection of the consumption by these Fuel for the year 2030 and according to that, the data for Petrol and Oil will reach a peak at nearly 50 quadrillion units and become the highest number of the chart. At that time, Coal will have an increase significantly to above 30 quadrillion units in the use and higher than that in Natural Gas which will reach 25 quadrillion units. The figures for natural energy will still remain at low levels of consumption, nearly 10 quadrillion units for Nuclear, above 5 quadrillion units for Solar/Wind and even just under 5 quadrillion units for Hydropower.
u.s. energy consumption by fuel
The line graph illustrates the data was released in a 2008 report about 6 different kinds of energy consumption in America since 1980 and the future forecast for 2030.
It can be seen that there were increase trends in most categories during the period of research. In addition, Petrol and Oil were used most during this period.
In 1980, the amount of Petrol and Oil consumed was 35 quadrillion units, nearly doubling that of Natural Gas, at 20 quadrillion units. The figure for Coal was slightly less at that time, just over 15 quadrillion units. In comparison, the consumption of natural energy was equal, standing at under 5 quadrillion units each. Each of energy was seen fluctuations during in the following years.
The charts also give the projection of the consumption by these Fuel for the year 2030 and according to that, the data for Petrol and Oil will reach a peak at nearly 50 quadrillion units and become the highest number of the chart. At that time, Coal will have an increase significantly to above 30 quadrillion units in the use and higher than that in Natural Gas which will reach 25 quadrillion units. The figures for natural energy will still remain at low levels of consumption, nearly 10 quadrillion units for Nuclear, above 5 quadrillion units for Solar/Wind and even just under 5 quadrillion units for Hydropower.

detask1cam9test4..png
