Writing Feedback /
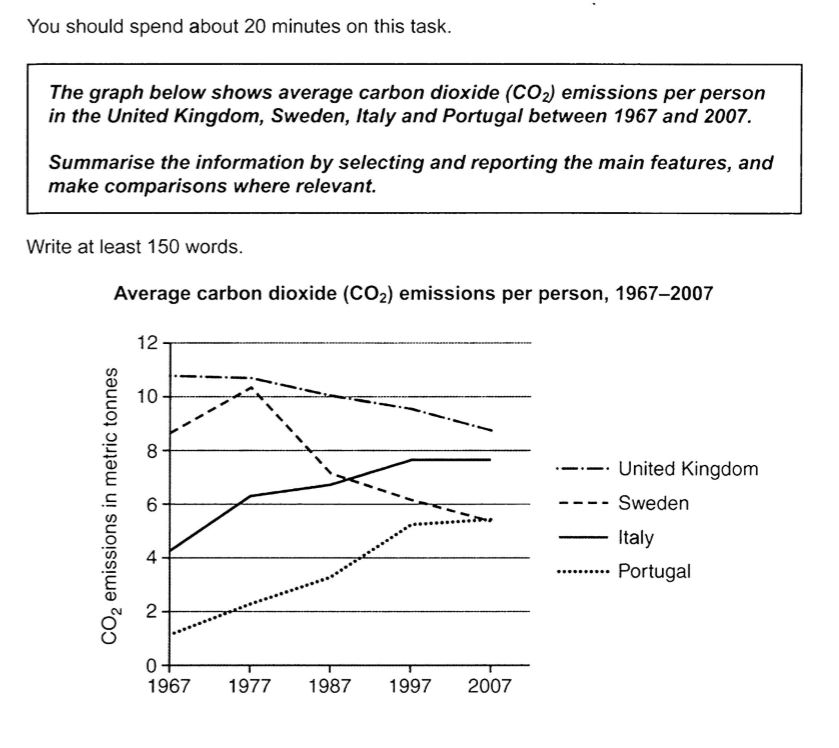
The graph depicts the proportion of releasing carbon dioxide from each citizen among four nations [4]
CO2 emissions per person in the UK
The graph depicts the proportion of releasing carbon dioxide from each citizen among four nations over a period of 40 years
Overall, we can observe that there was a significant upward trend in Italy and Portugal while as opposed, the UK and Sweden experienced a downward of CO2 emissions.
Regards Italy, it started at over 4 metric tonnes at the beginning of the time but then slightly rosed to more than 6 metric tonnes in the next 10 years. Moreover, Italy constantly increased to 2 units in 1997 and maintained the same till the end which was nearly 8 metric tonnes. When we look at Portugal, the similarity was existing. At first, it was under 2 metric tonnes but then went up remarkably after four decades being peak of nearly 6 metric tonnes, three times more than beginning.
In contrast, the UK and Sweden witnessed the opposite tendency. The UK was the highest contributor in releasing carbon dioxide reaching around 10 metric tonnes. However, it slowly went down to approximately 8 metric tonnes in 2007. With respect to Sweden, it fluctuated from more than 8 metric tonnes up to more than 10 but decreased rapidly to nearly 6 metric tonnes in the next three decades.

cambridge11ielts.p.png

